In this experiment, we will demonstrate the wave properties of light and its interactions with small obstacles placed in its path. We can estimate the width of this obstacle by observing the resulting interference patterns. This lab is based on the SPS Hair Diffraction Lab, although we will be extending it with additional observations and a verification experiment at the end.
Background
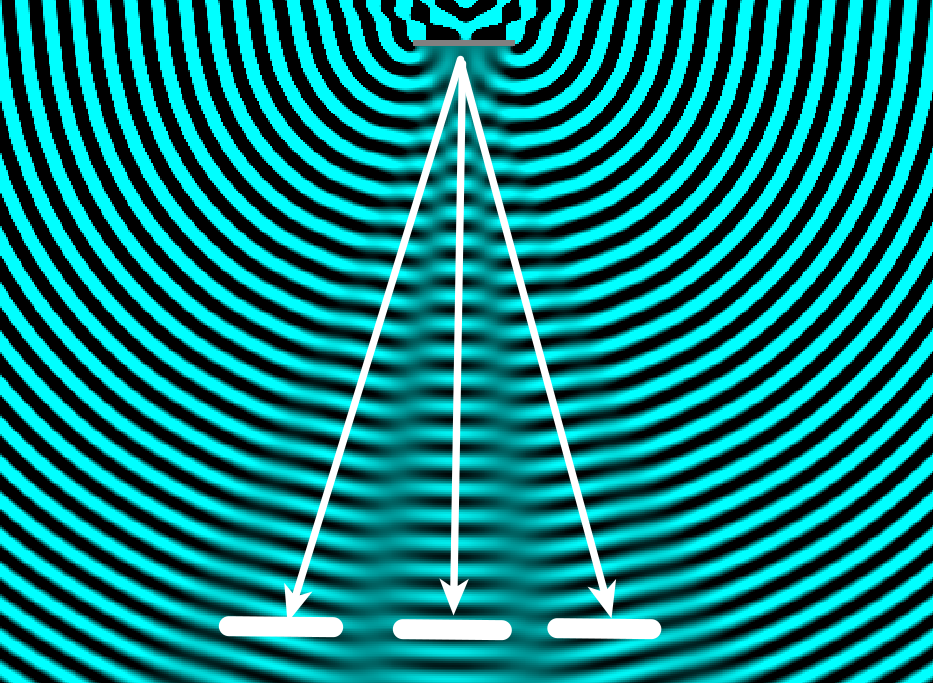
Light has an interesting property in that it can act as both a series of waves and as a stream of particles. This is called the wave-particle duality and is one of the fundamental principles of quantum mechanics. Today, we will be focused on the wave properties of light. In particular, we will look at its tendency to bend around objects, which is called diffraction, and its ability to add up or cancel out with other light waves, called interference. When waves (not just light) diffract around an obstacle, you end up with areas with stronger waves and others with almost no waves as a result of interference. This is most visible when the waves are all a single wavelength, such as in a laser.
When projected onto a flat surface, the interference creates a distinct pattern, like a series of dots or lines. The geometry of this pattern depends on how far away the flat surface is, the wavelength of light, and the size of the obstacle. If we know the distance to the surface and the wavelength of the light we’re using, we can use this relationship to solve for the size of our obstacle.
Safety
- This lab uses lasers. Only use lasers with an output power of 5mW or lower and do not look directly into the beam.
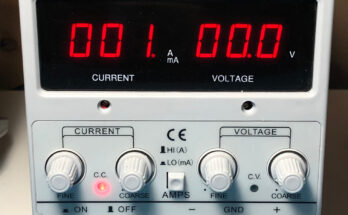
- If you are using a laser with an external power supply, double-check your wiring and power supply settings before turning on the laser.
Materials
- 650nm Red Laser
- Most cheap red laser pointers or diode laser modules are this wavelength (give or take)
- Whiteboard or Poster Board
- Also bring a pen or pencil–you’ll be tracing the interference patterns on the board.
- Measuring Tape
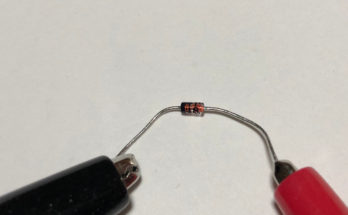
- Thin, Uniform Objects with a Round Cross-Section (such as hair)
- The most commonly available object that fits this description (and is most often used in this experiment) is your own hair! (please only use your own hair)
- Other objects I’ve tried:
- Carpet Fibers
- Individual Strands of Electrical Wire
- Thin Fishing Wire or Monofilament
- 3D Printed Plastic (I’ll explain later–this is really cool)
- A Sturdy Object to Hold Things
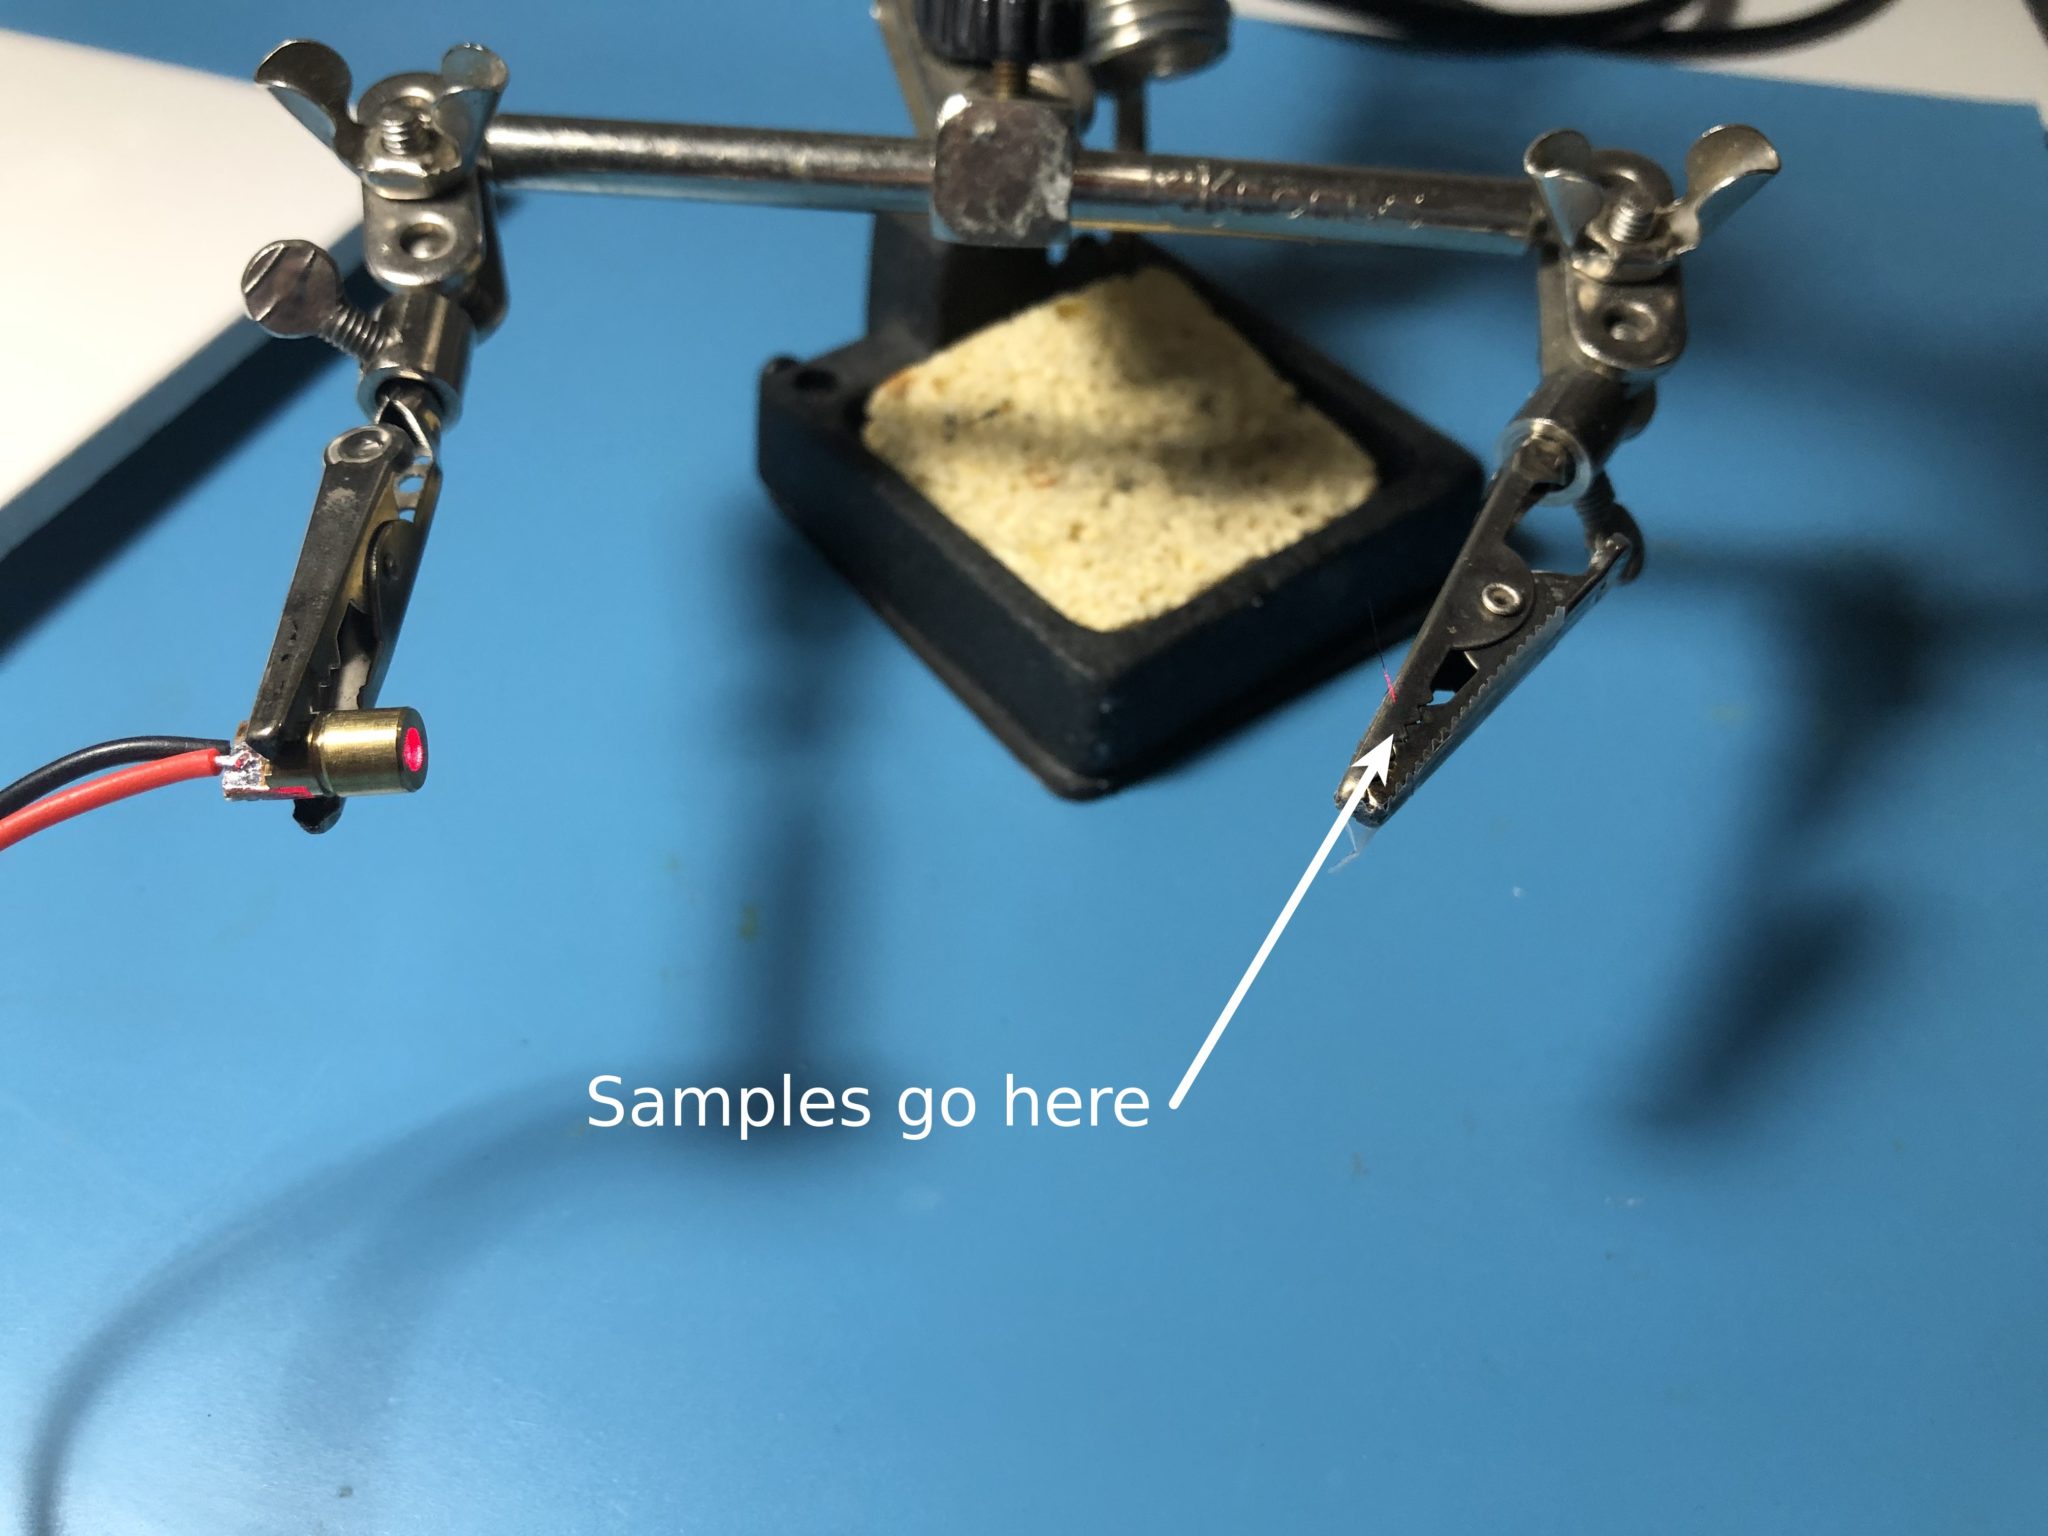
- Being in an electronics lab, we used a tool called a Helping Hand–basically a heavy base with movable alligator clips.
- Anything that can simultaneously hold your laser and your sample will suffice.
- A Large, Dark Room
- Preferably, you’ll want around 10 feet (3 meters) of unobstructed space. A hallway would work pretty well for this.
- Caliper or Micrometer
- You’ll want something that can measure very small distances (on the order of a few 10’s of μm) My digital caliper goes down to 10μm, although its accuracy is questionable. It’s fine, we’re just trying to estimate here.
Procedure
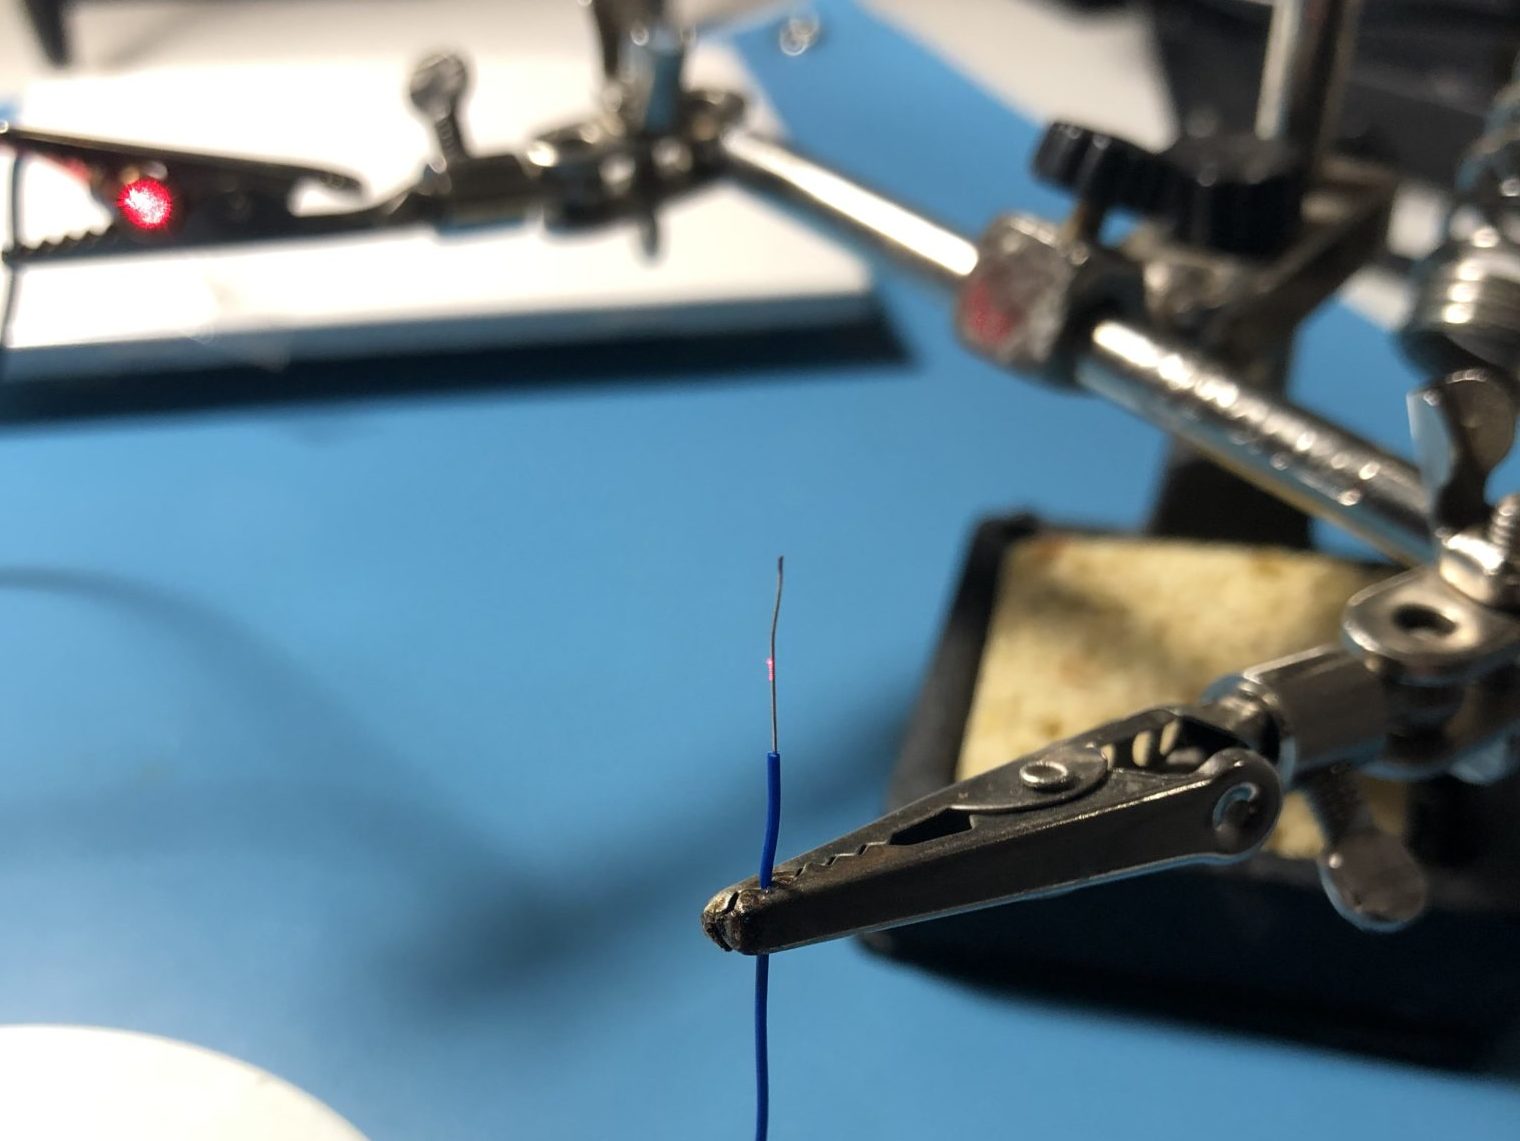
- Secure the laser on your workbench using your Helping Hand. Position the laser so that the other alligator clip can hold samples in front of the beam without blocking it.
- On the other side of the room, prop up the board at about the same height as the laser.
- Turn on the laser and aim it so that it shines onto the center of the board.
- Use the Helping Hand to hold your sample vertically in front of the beam. You may need to do some adjustments, but eventually you should see a series of lines or dots forming.
- If your sample is very thin, you may need to use tape to hold it. Just make sure the tape doesn’t cross the laser beam.
- Measure and record the distance between the sample and the board.
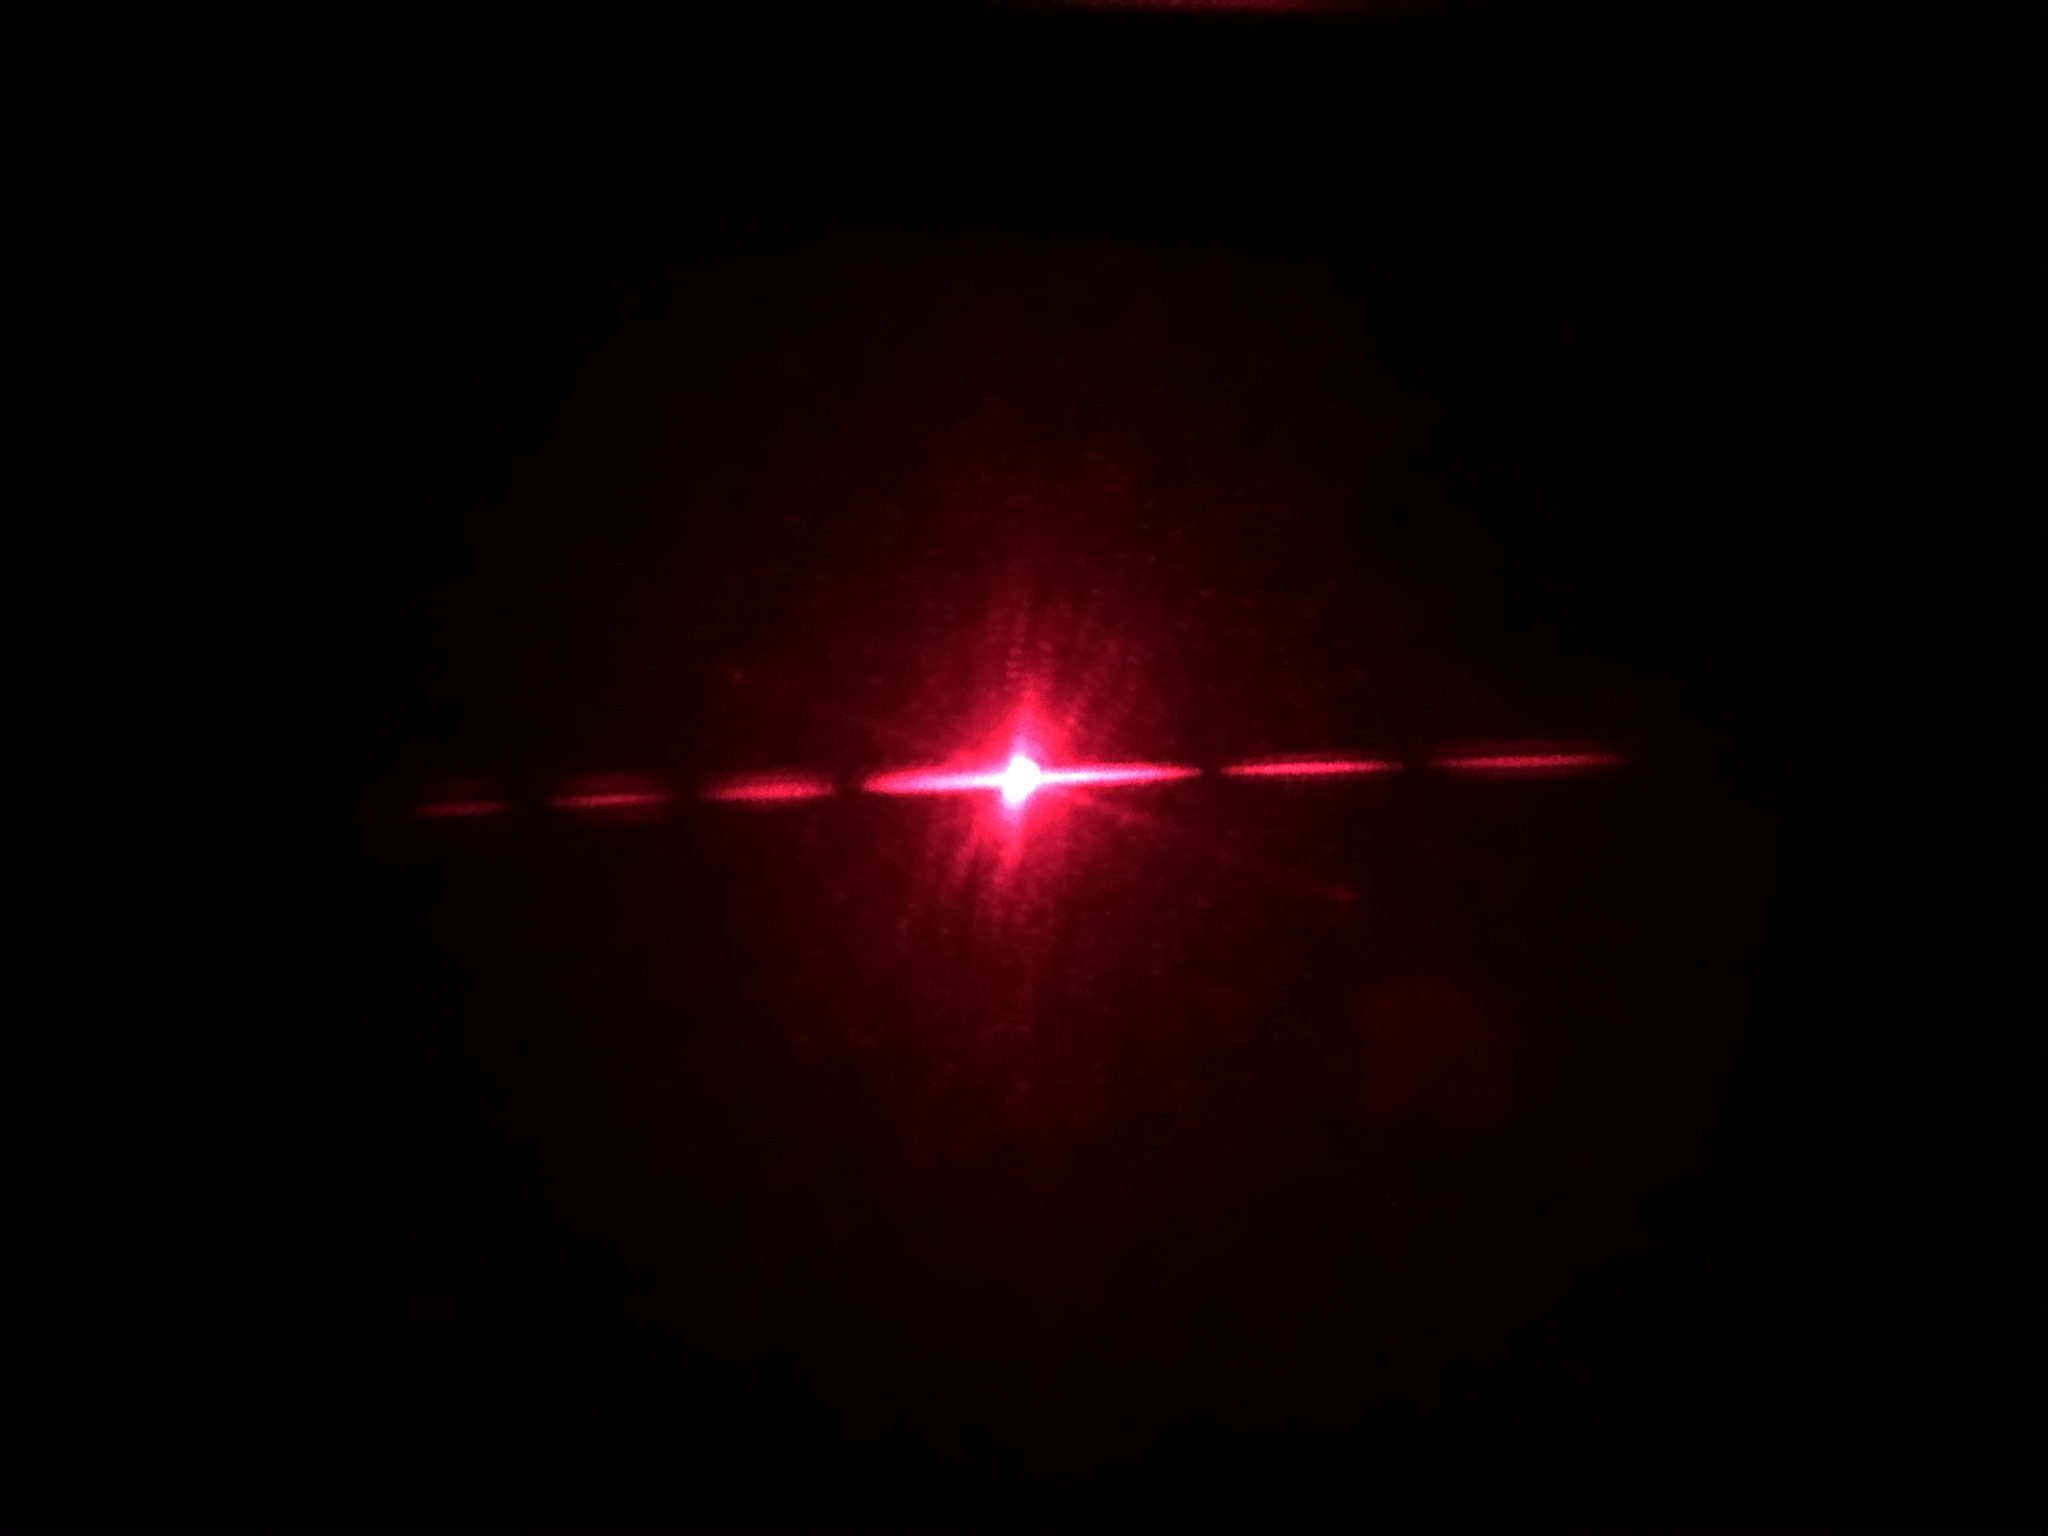
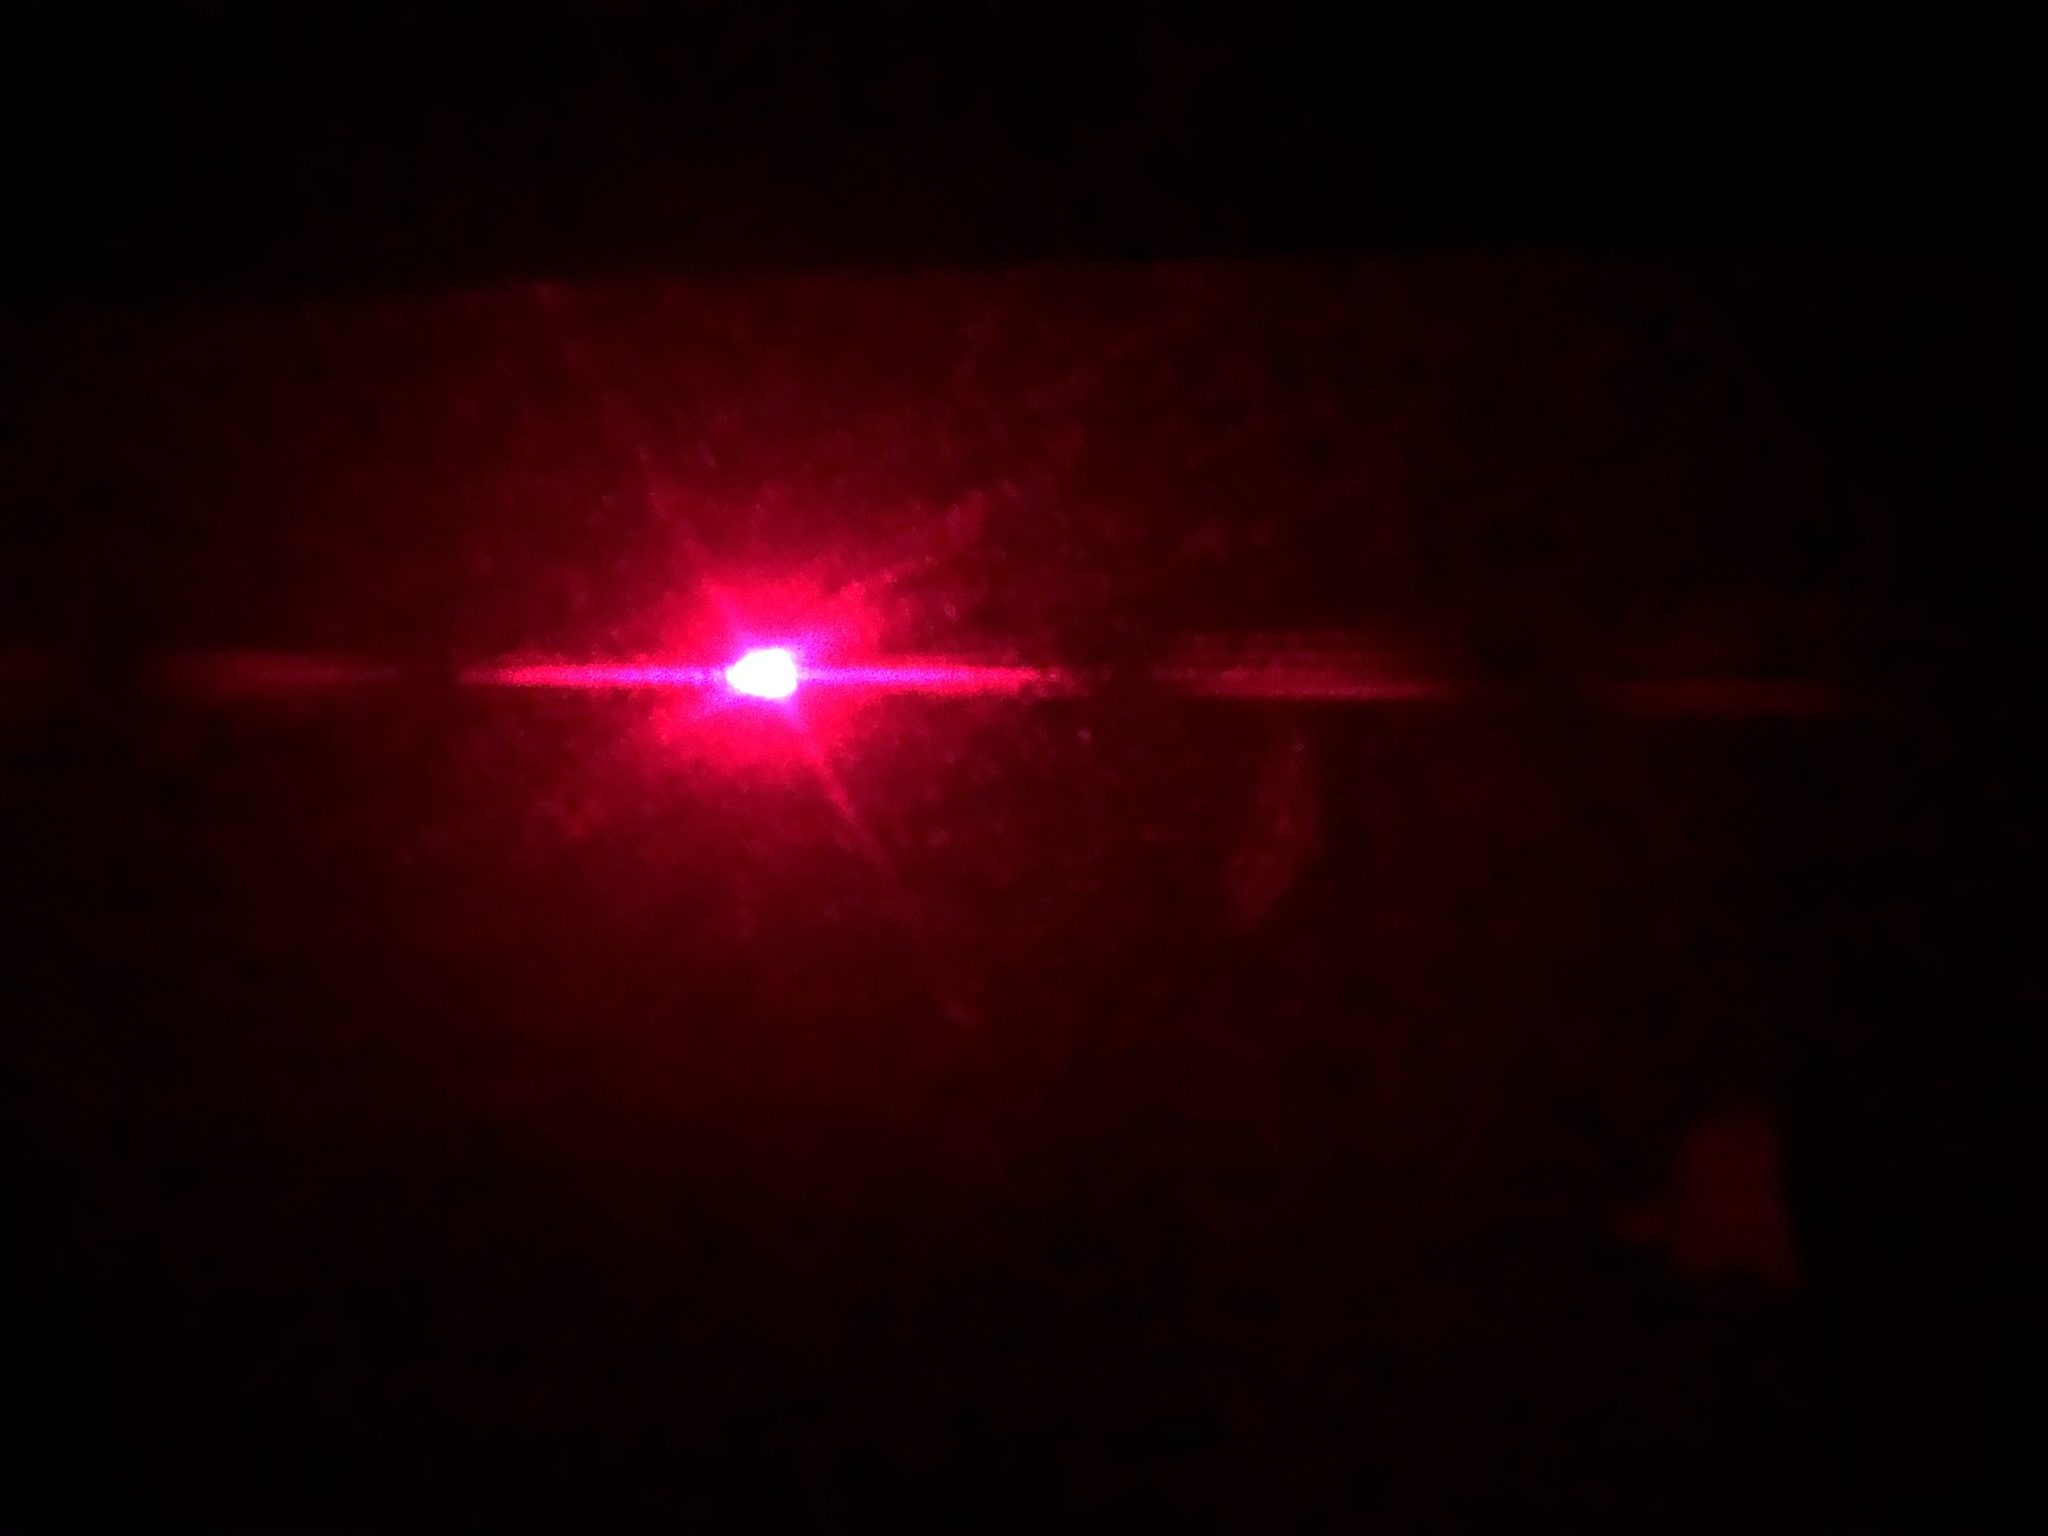
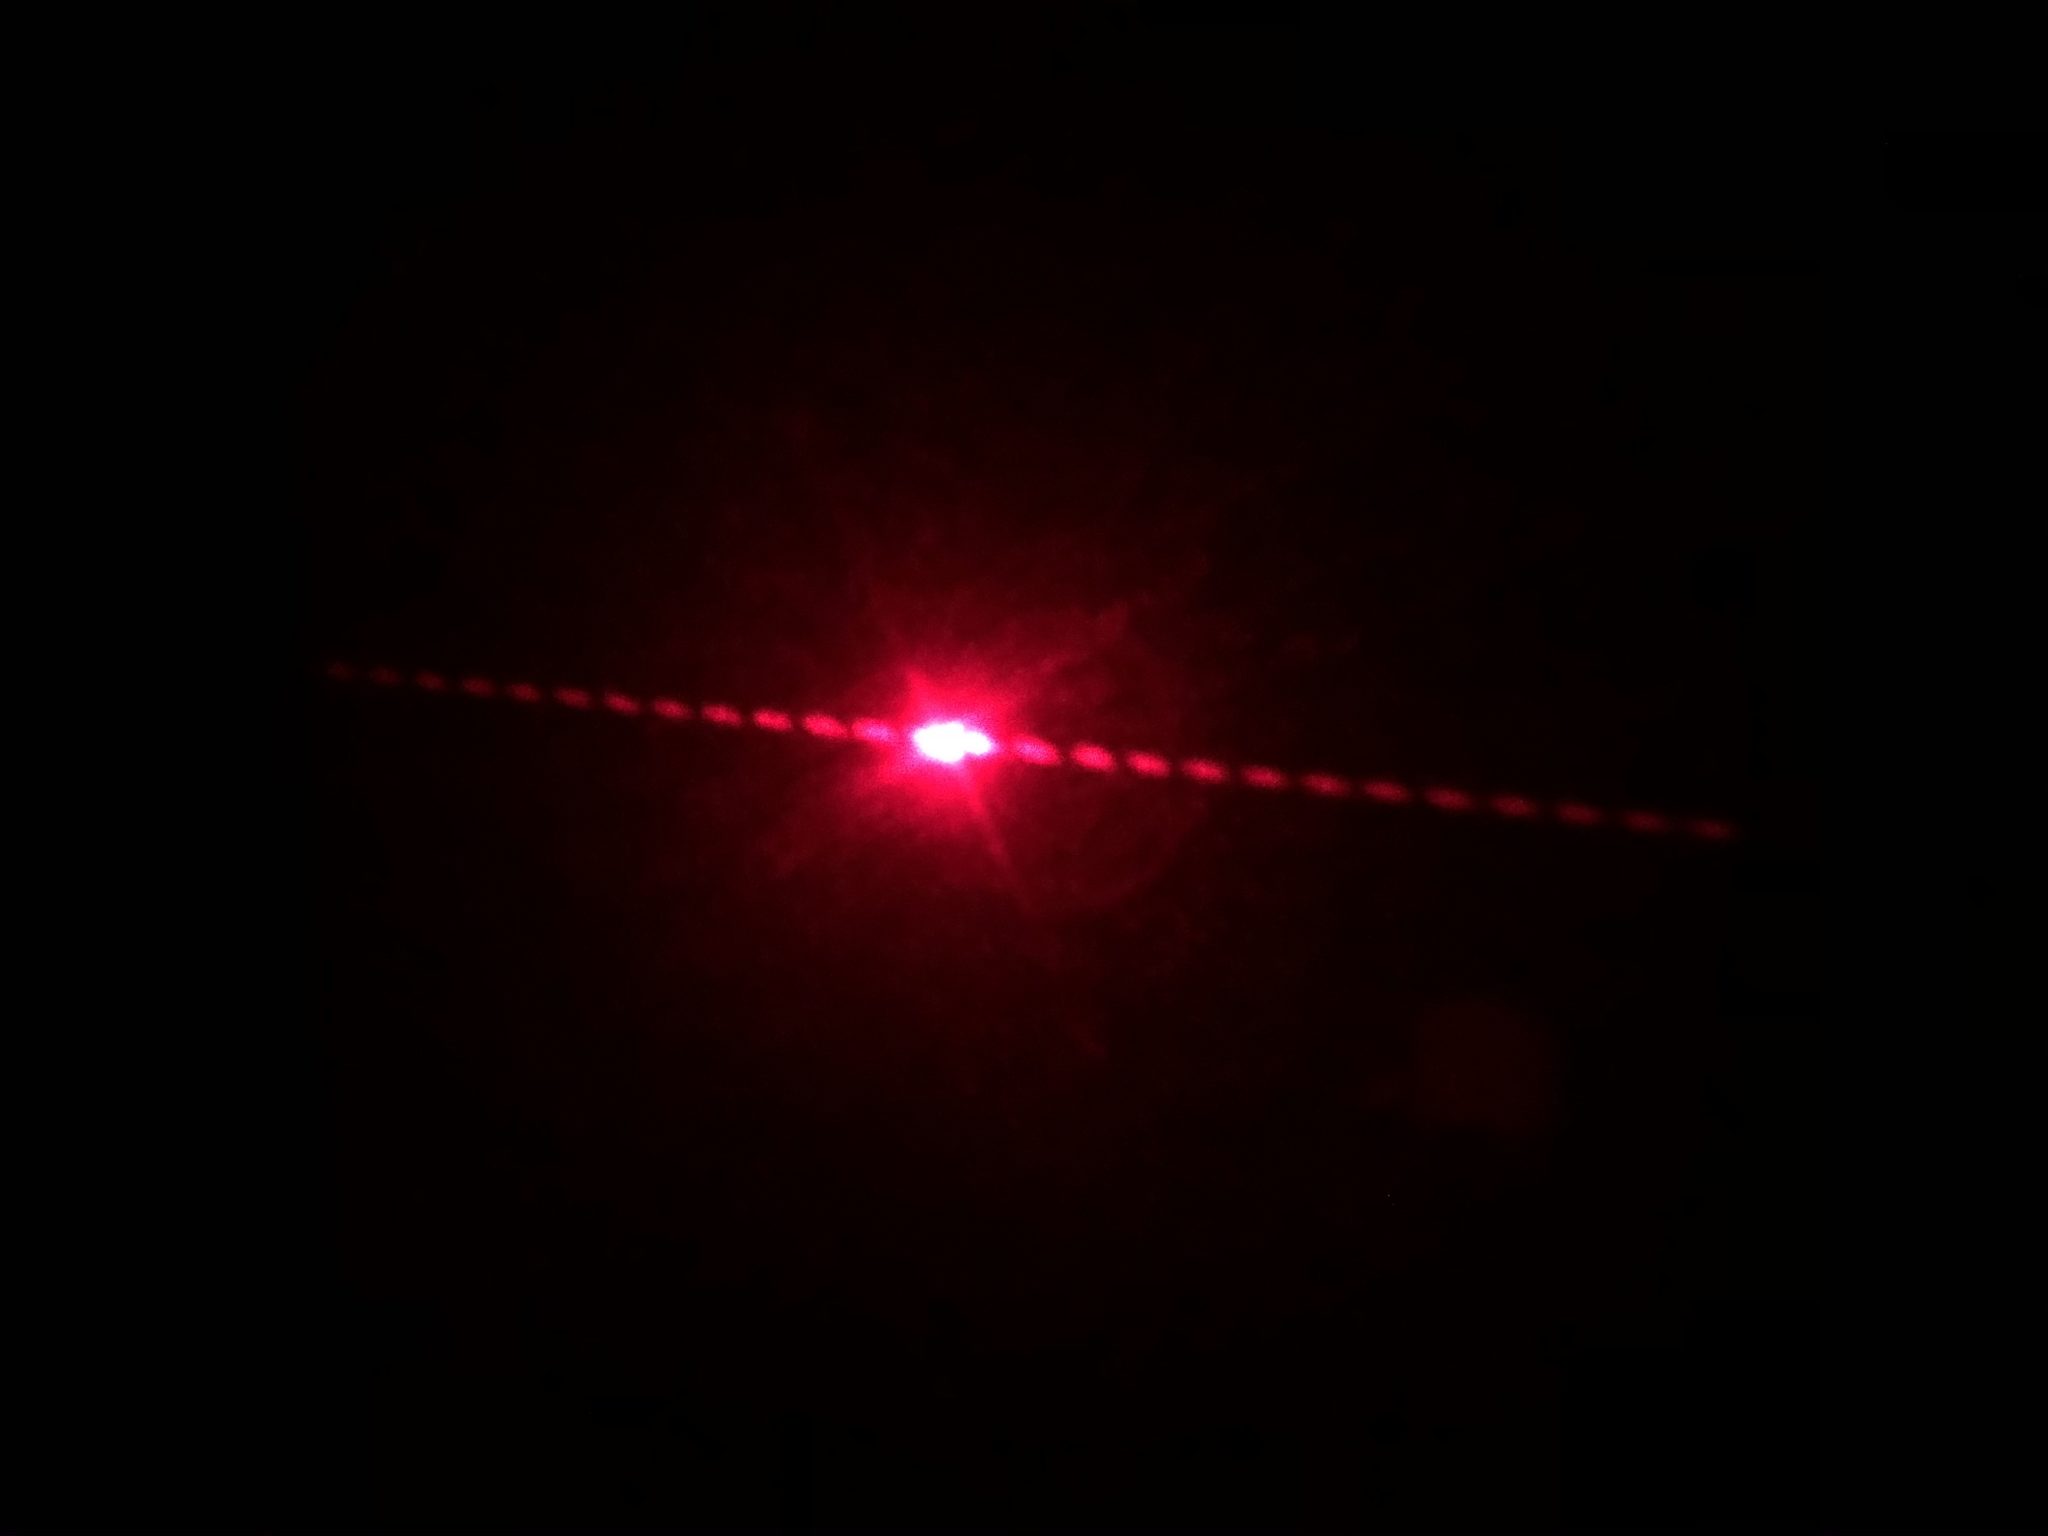
- Walk over to the board and mark the bright center spot of the laser beam. Then, mark all the dark spots you can see on the line to the left and right of the center spot.
- Turning off the lights will make the pattern more visible.
-
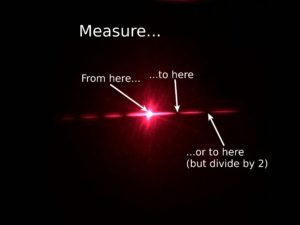
These are the places to mark and measure.
- Record the distance between the marks you made for the center bright spot and the first dark spot.
- If they’re too close together to get an accurate measurement, you can measure the distance to the second or third (or more) dark spot. Just remember to divide by 2 or 3 (or more) respectively. The dark spots are evenly-spaced.
- Solve for the thickness (d) of your sample using this formula:
-

- Make sure to convert all your units to meters.
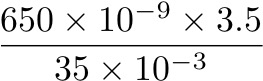
- As an example, here’s what the equation looks like with a 650 nm laser, a distance of 3.5 m to the board, and 35mm between marks:
- Multiply the result by 1,000,000 to get the thickness in μm or microns.
-
- Measure the sample with your micrometer and compare this measurement with your answer.
- Repeat steps 4-9 for all your samples. If you don’t move your sample holder too much, you can skip Step 5.

Discussion
- You should notice that the distance between marks changes depending on the sample’s thickness. Do the dark spots get closer or farther away for thinner samples?
- What would happen to the patterns if you used a green laser (which has a shorter wavelength)?
My Results (spoiler alert!)
For my experiment, I used the following values:
- Laser Wavelength: 650 nm
- Distance to Board: 3.5 m
I tested the following samples:
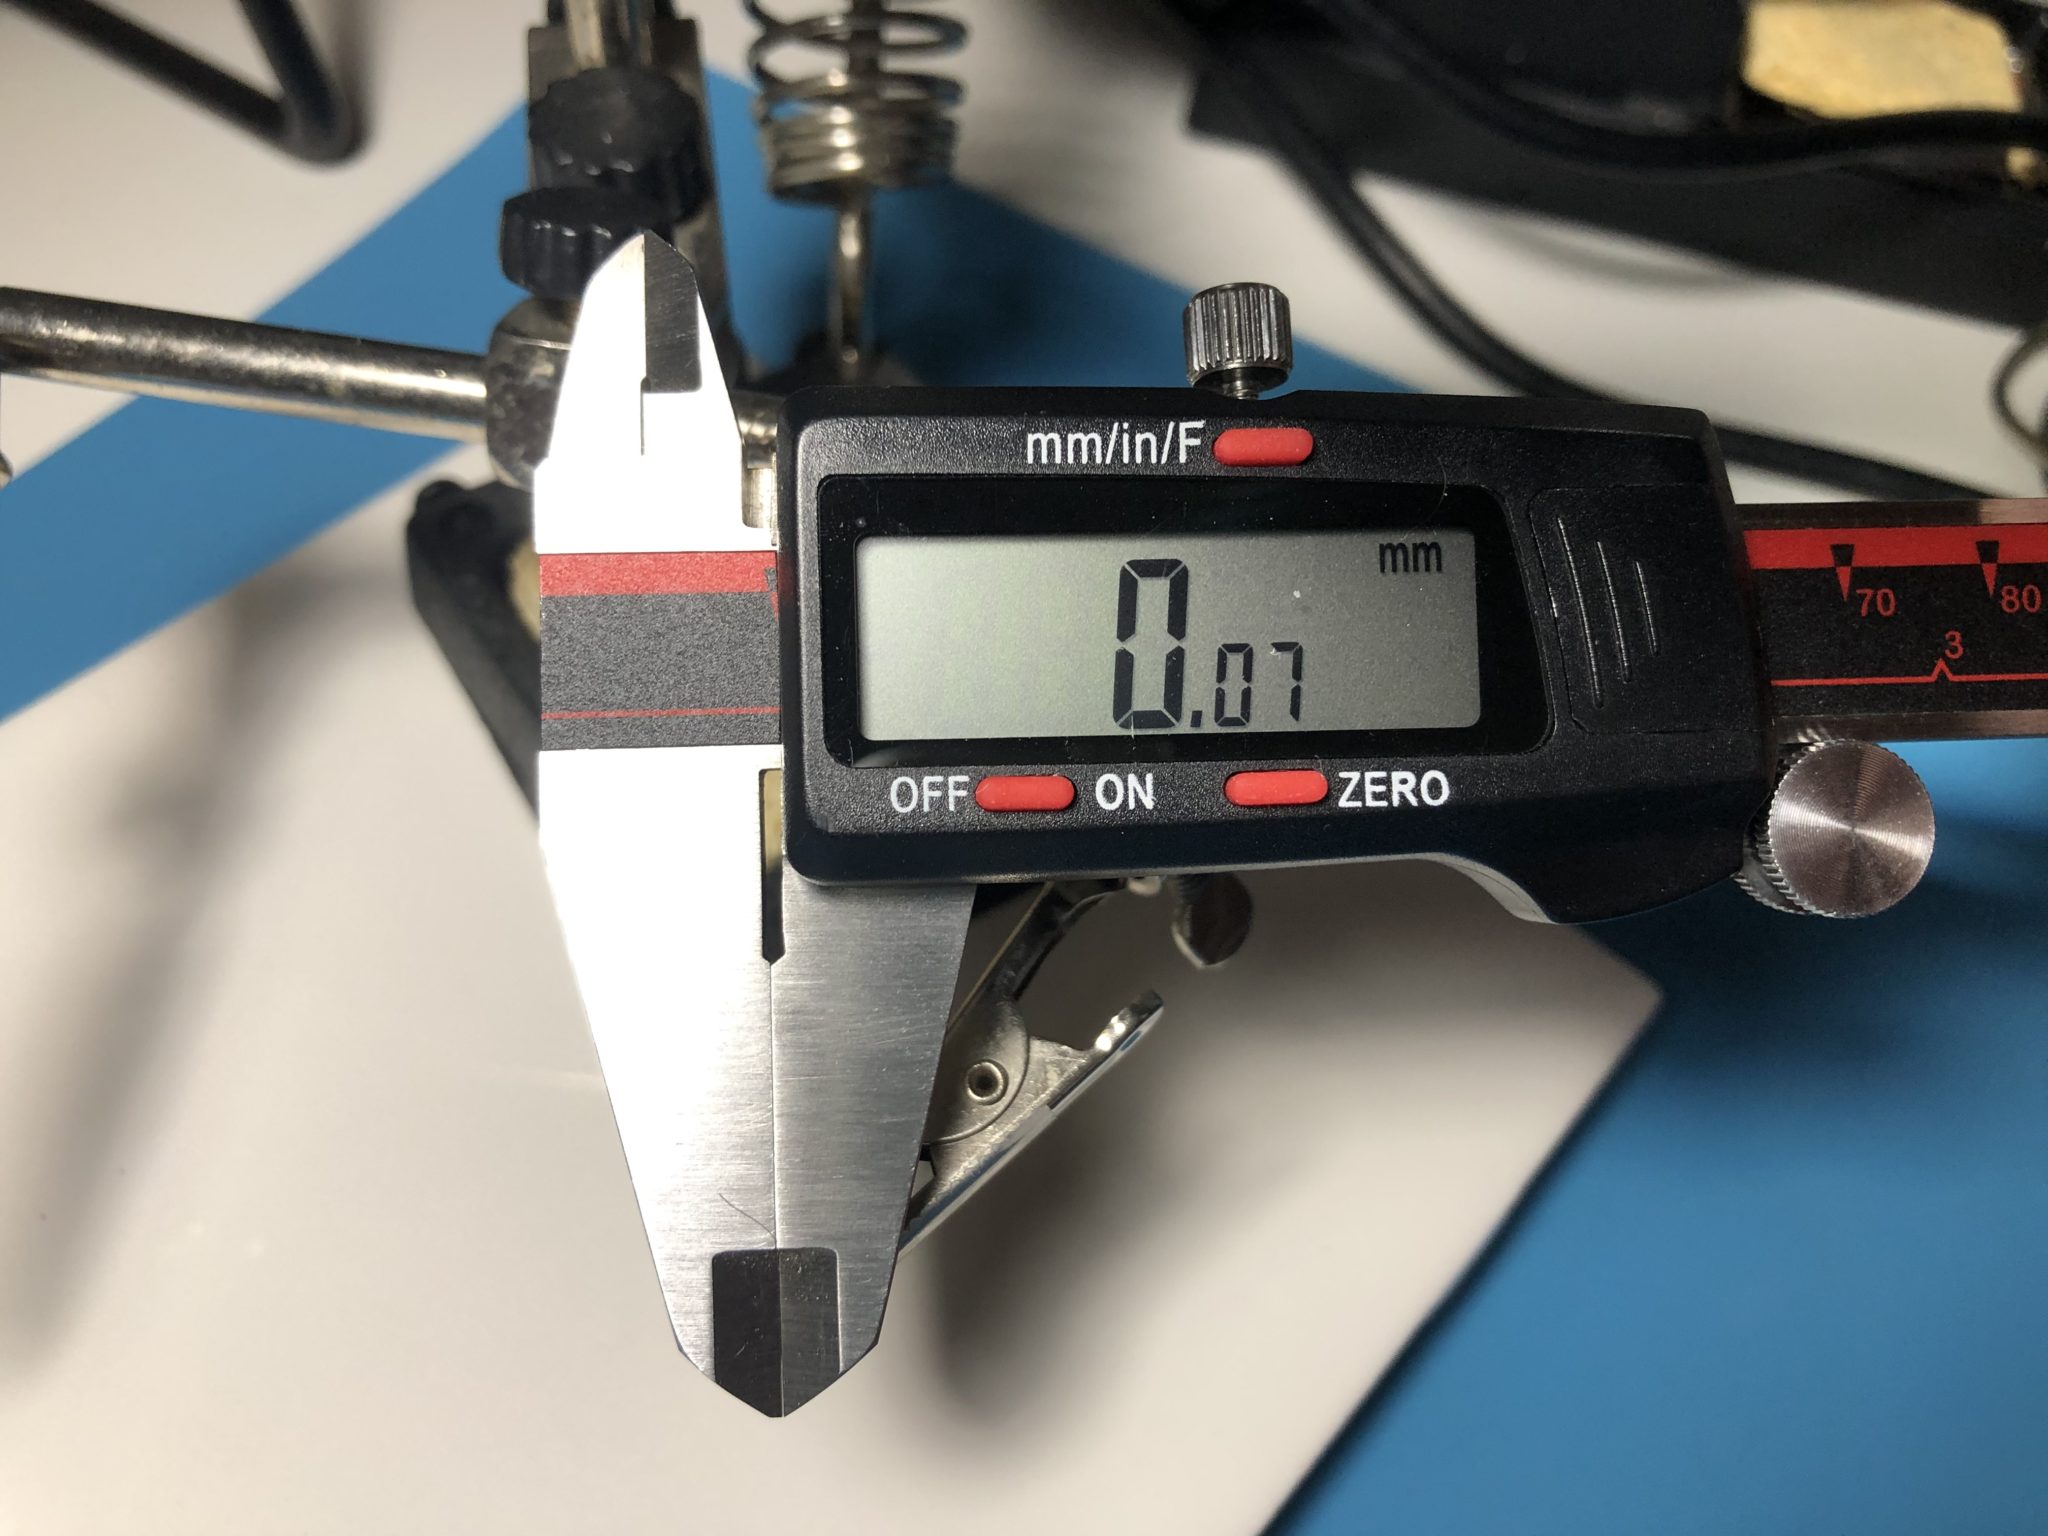
- My Hair: Pretty self-explanatory
-

You can barely see the hair in the caliper jaws, but it still registers on the display.
-
- 30 AWG Wrap Wire: This is super-thin wire. According to the AWG standard, this should be ~255 μm thick.
-

Be sure to pull off the insulation, as it is quite thick.
-
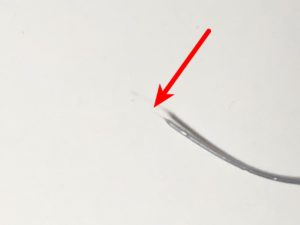
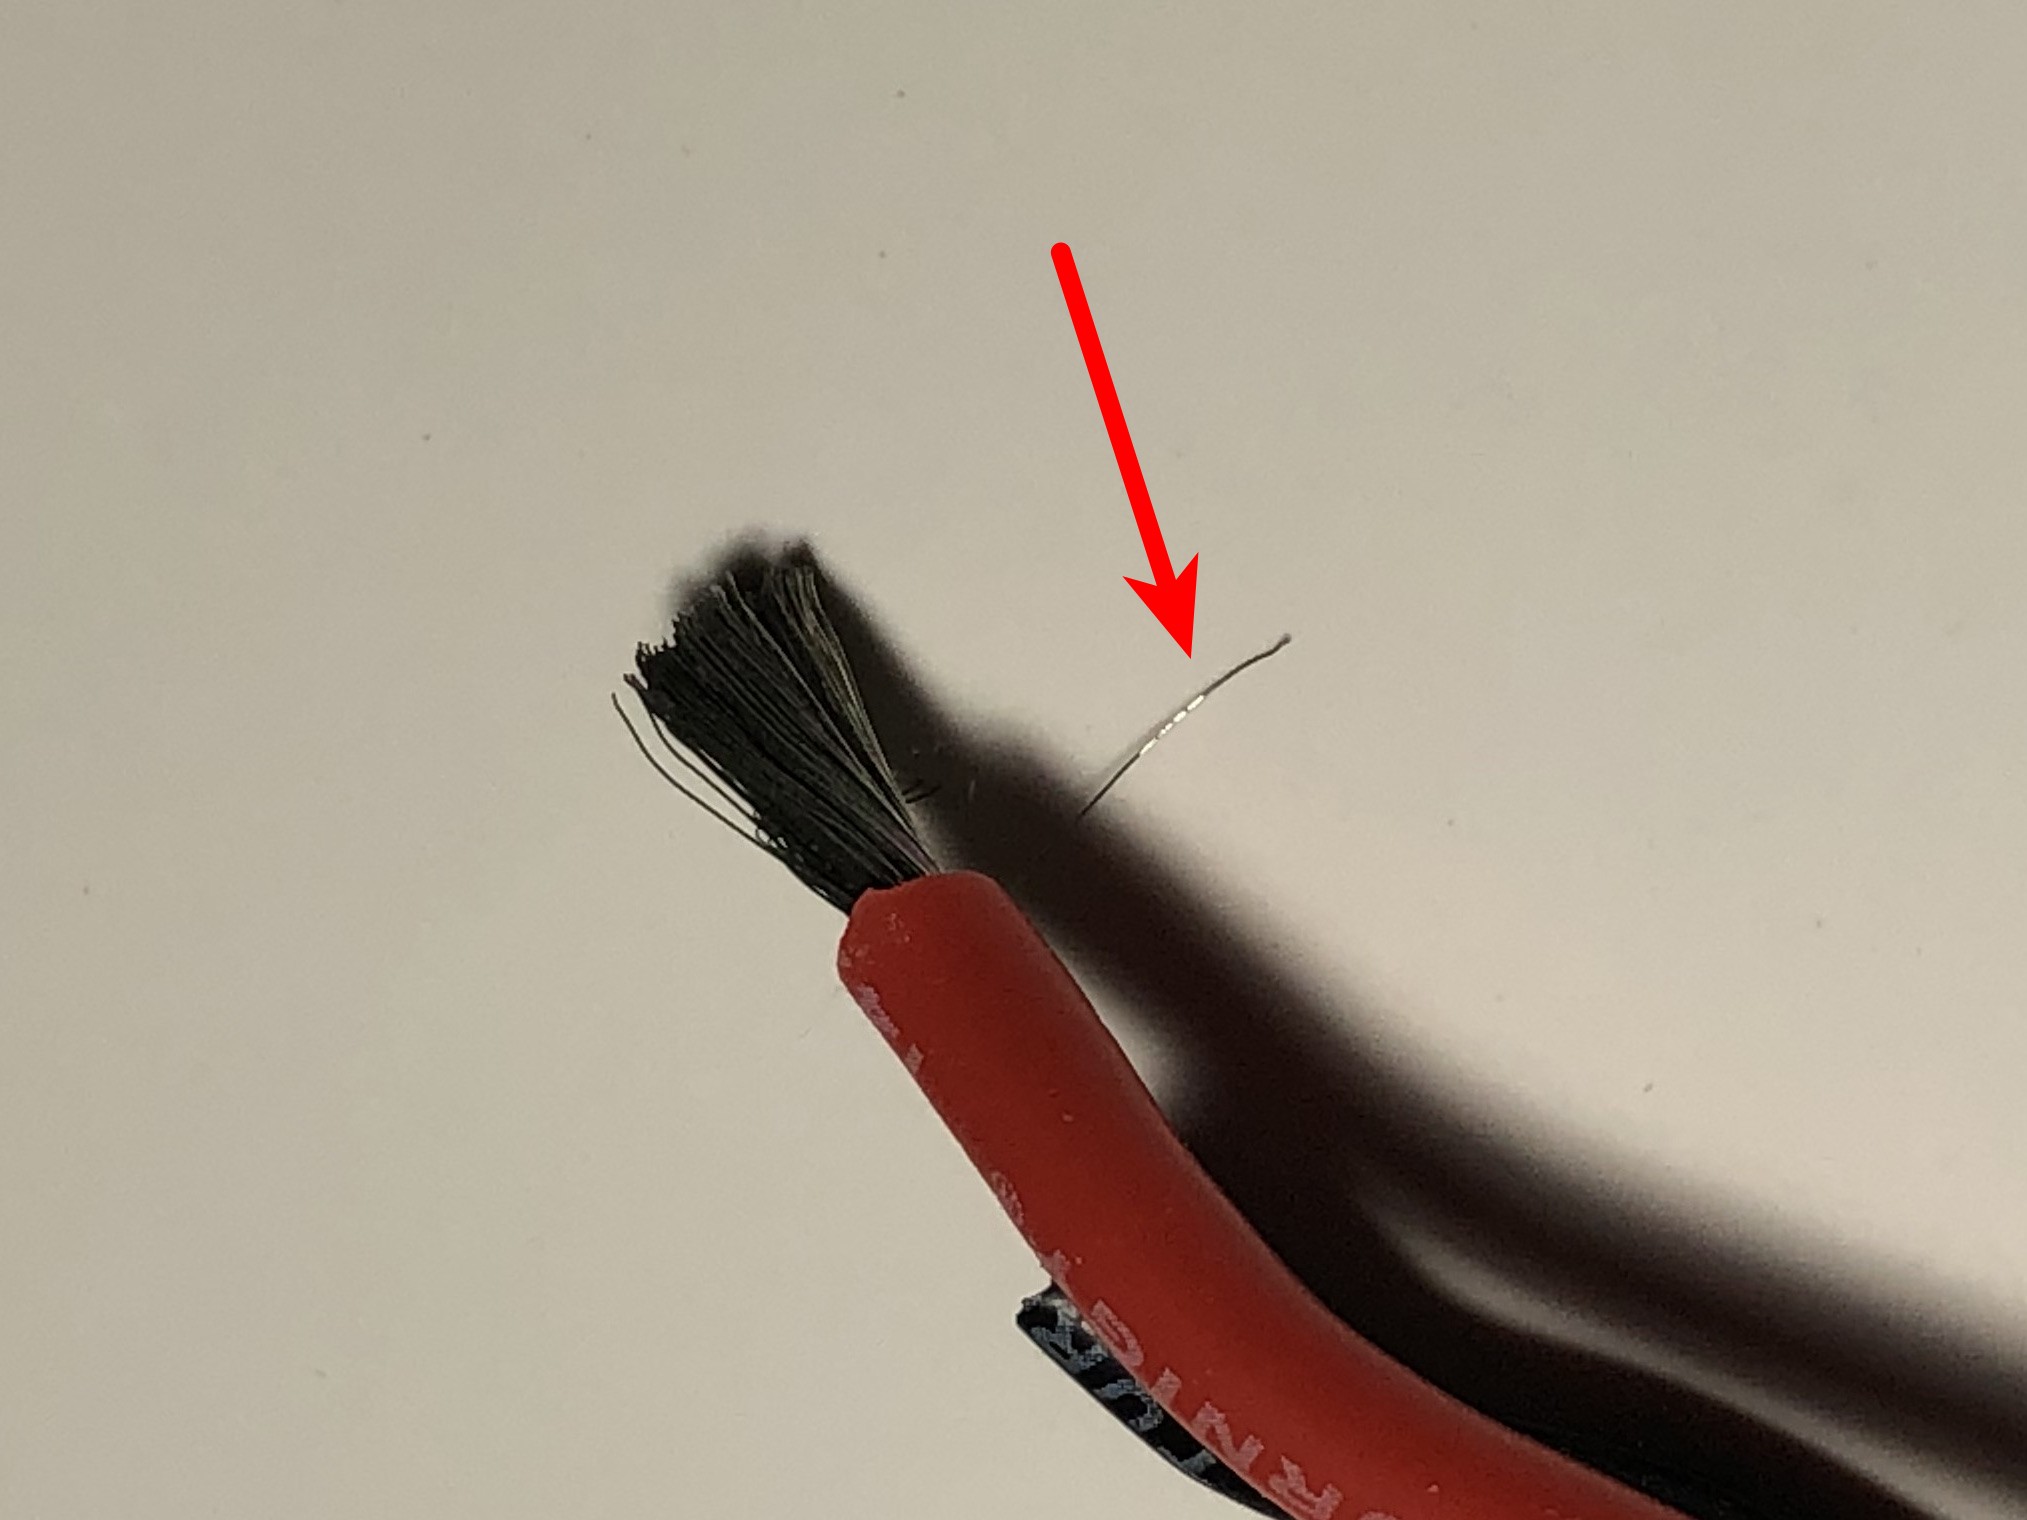
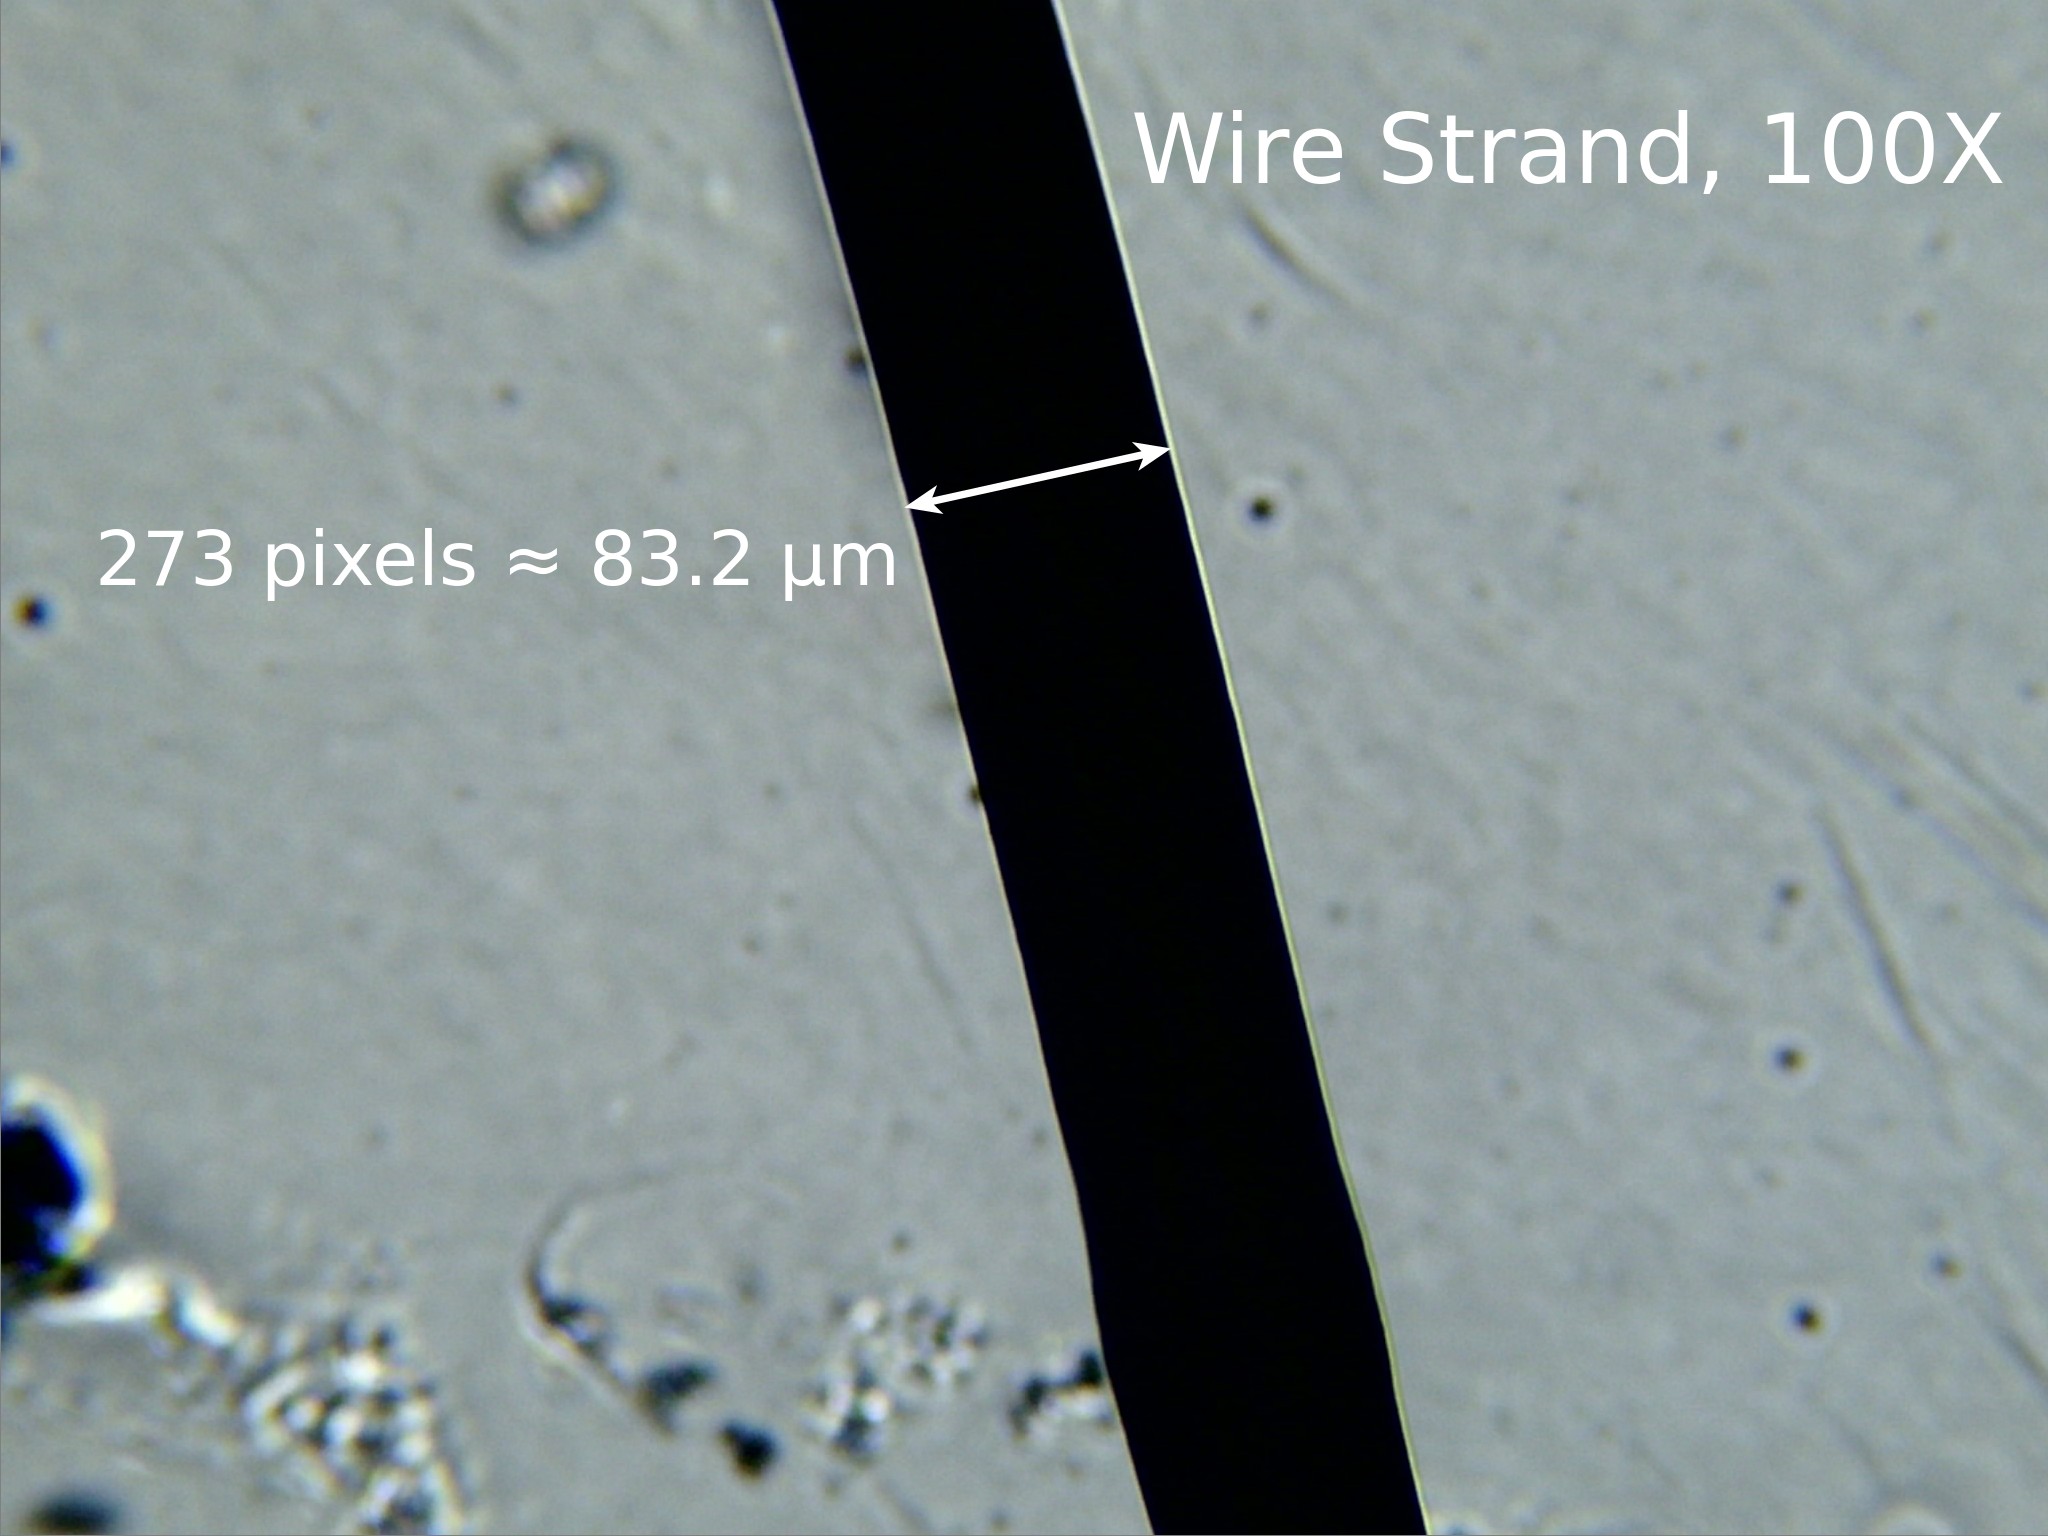
- Single Wire Strand: Even thinner than 30 AWG. This is from a type of wire called “high strand count”, which means that, instead of having a single solid conductor, they bunch up a lot of super-small strands, which makes it very flexible. Although the wire itself is quite thick, the individual strands are absolutely tiny.
-
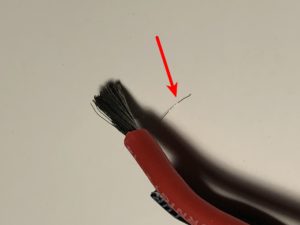
These are power leads for a model airplane battery. The arrow points to a single strand, which on its own is quite thin.
-
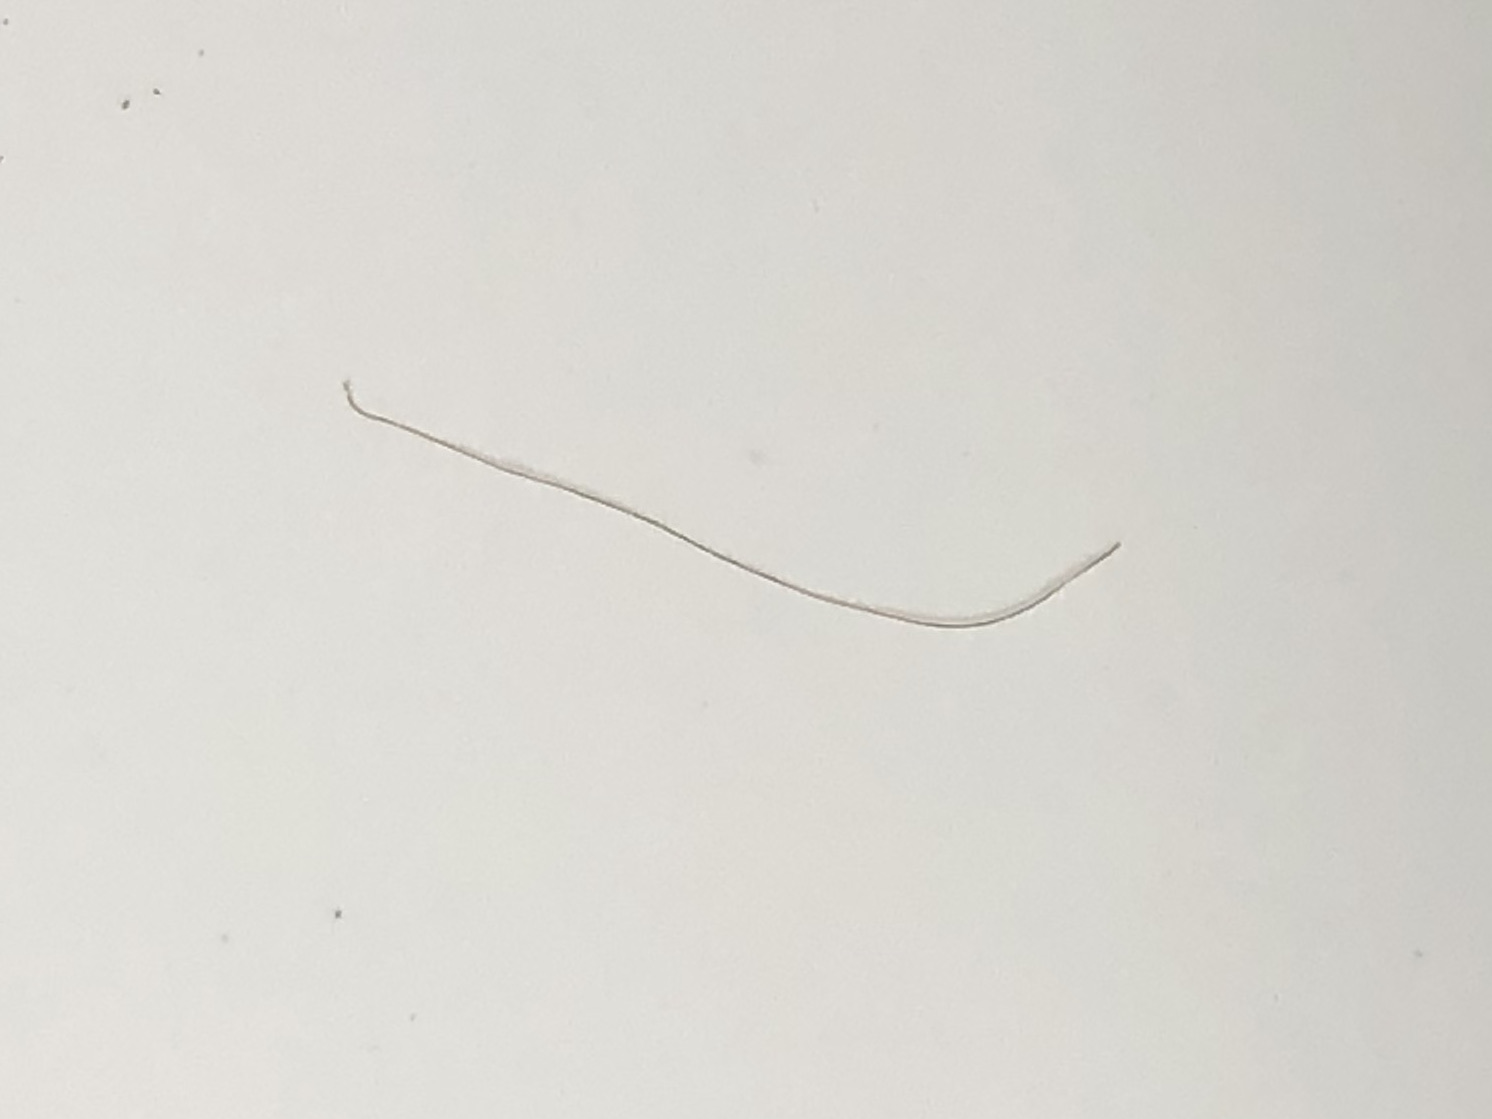
- Carpet Fiber: Literally just went under my desk and yanked some out with tweezers. (shhh, don’t tell maintenance)
-
A single fiber from our carpet. You might need to straighten it a bit before use.
-
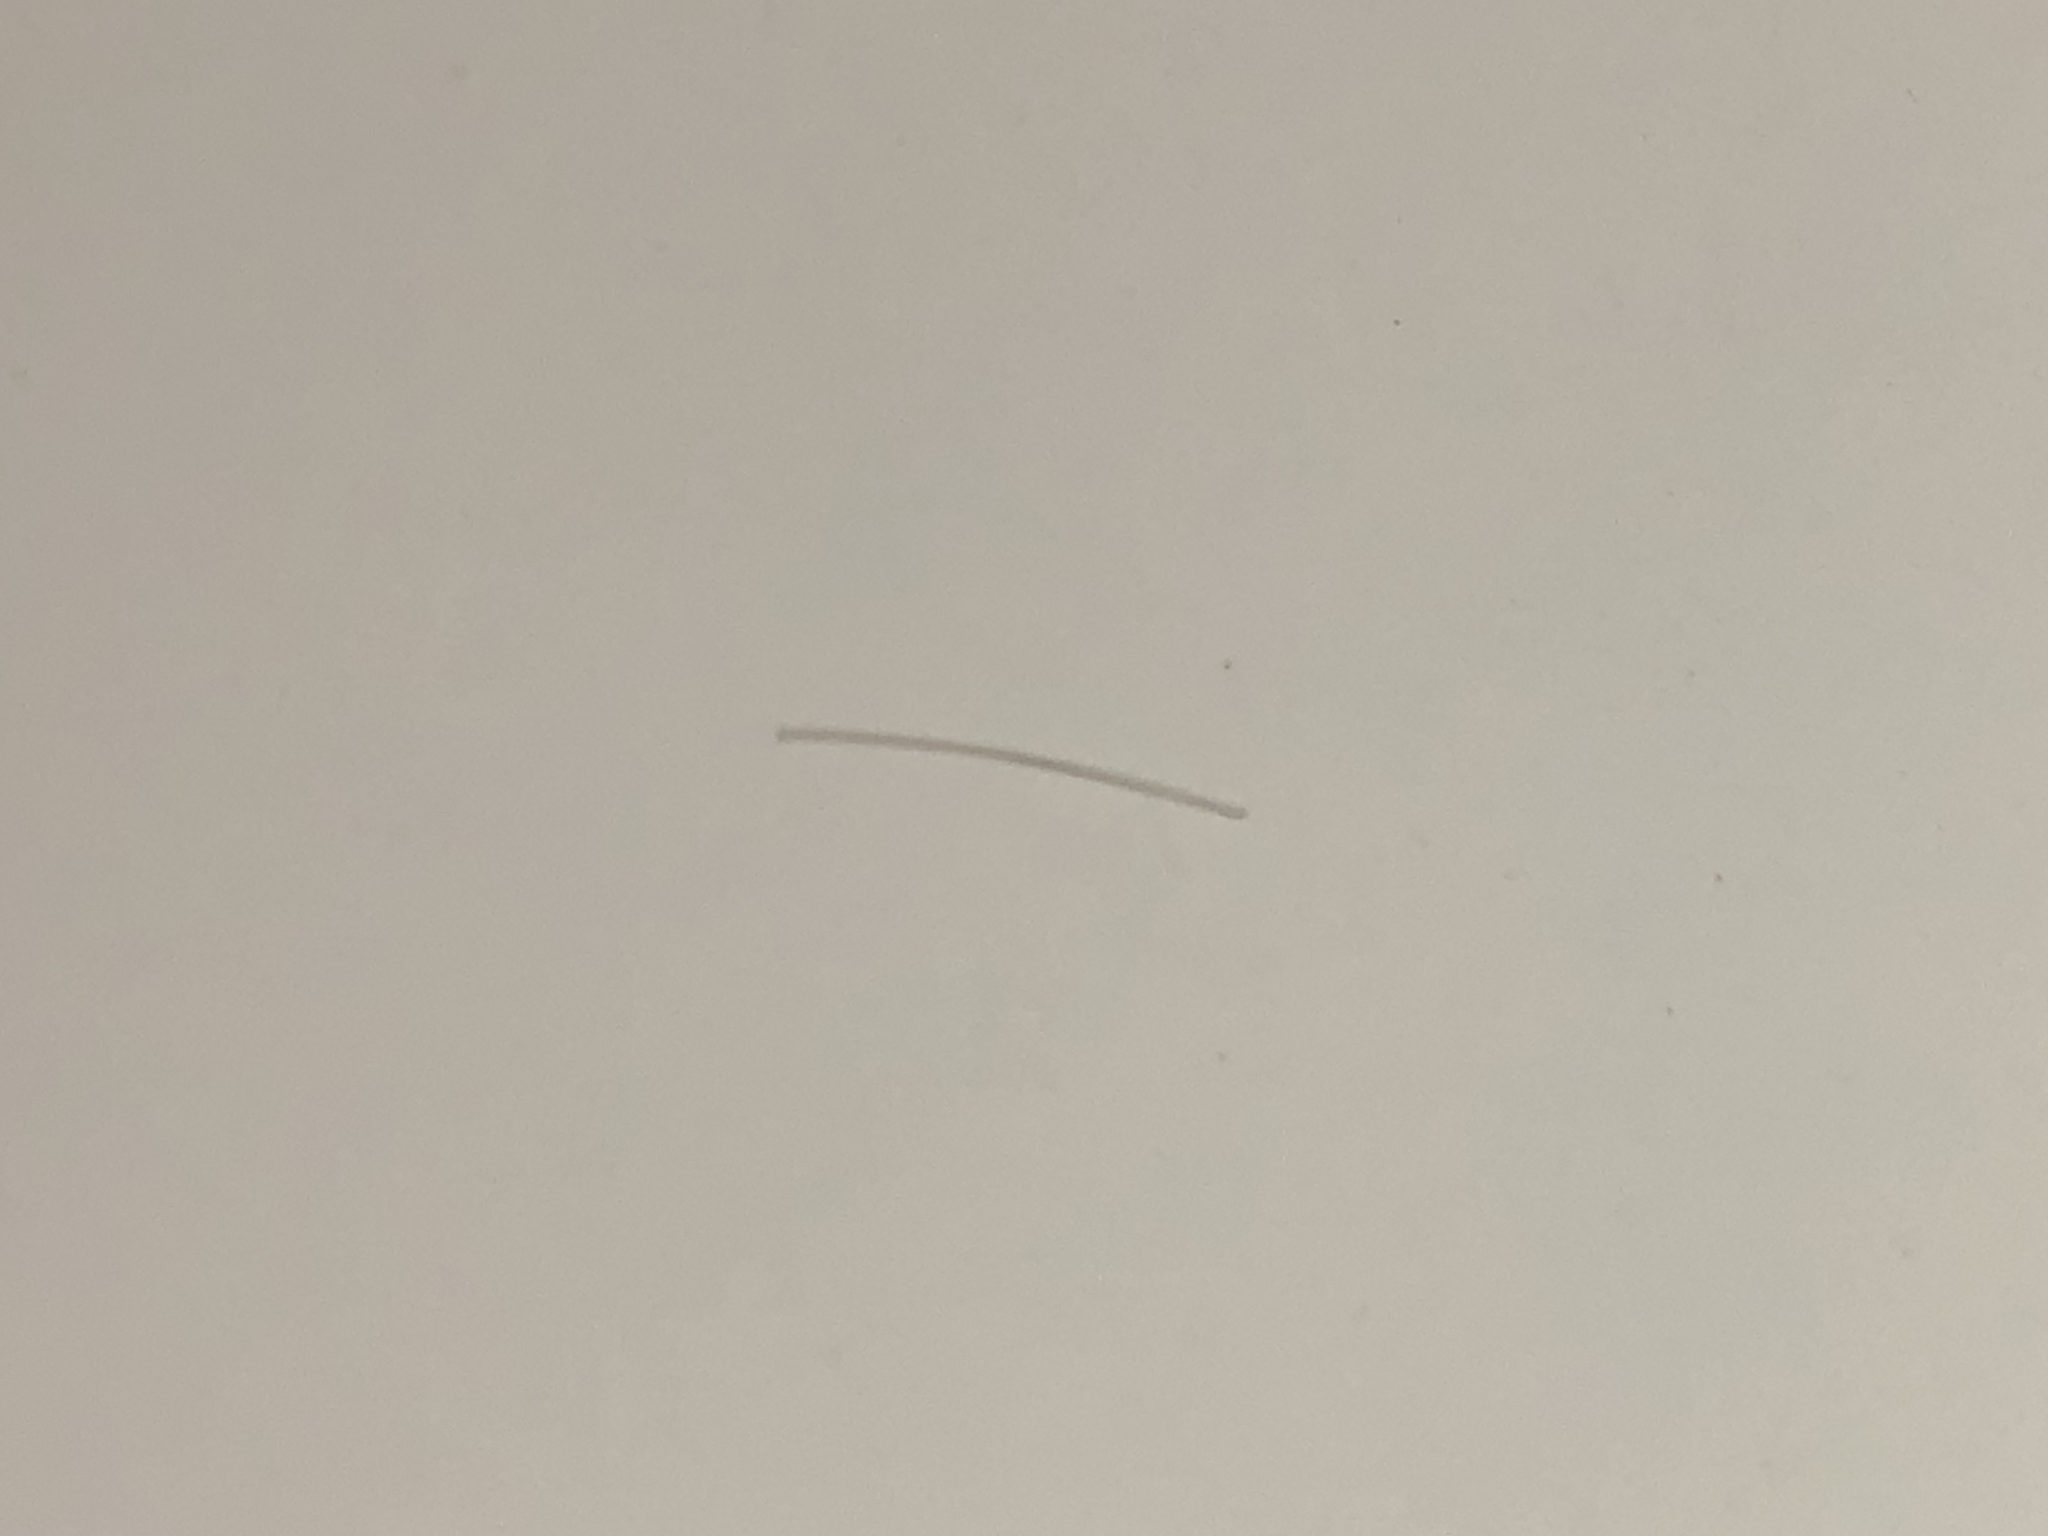
- Monofilament: I believe this was 3-pound fishing wire. Considering it’s nearly transparent, I’m surprised it worked as well as it did.
-
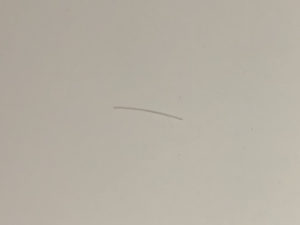
A piece of monofilament.
-
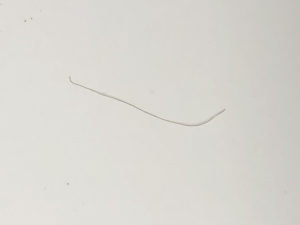
- 3D Printed Plastic: This one’s pretty interesting. When a 3D printer nozzle heats up, it always drips a tiny bit of plastic. If you grab onto that piece of plastic right as it’s about to fall and quickly pull it off (with tweezers please, don’t burn yourself), you’ll draw out a long, extremely thin strand of plastic. In fact, this is pretty similar to how they make fiberglass.
-
This piece of plastic was pulled out of the nozzle of my 3D printer. It might look thick, but the part we are actually interested in is the barely-visible strand of plastic hanging off the end.
-

| Sample | Distance Between Marks | Calculated Thickness |
| Hair | 35 mm | 65.0 μm |
| 30 AWG Wrap Wire | 11 mm | 206 μm |
| Single Wire Strand | 31 mm | 73.4 μm |
| Carpet Fiber | 57 mm | 39.9 μm |
| Monofilament | 12 mm | 190.0 μm |
| 3D Printed Plastic | 128 mm | 17.8 μm |
Microscope Time
Fun fact: I’m a bit of a biology enthusiast as well, and happen to have a digital microscope. By taking pictures of my samples, I was able to measure their thickness by counting pixels. Then, with the help of a calibration slide, I was able to convert these pixel values to microns. As we always learn in physics, “Trust, but Verify”.
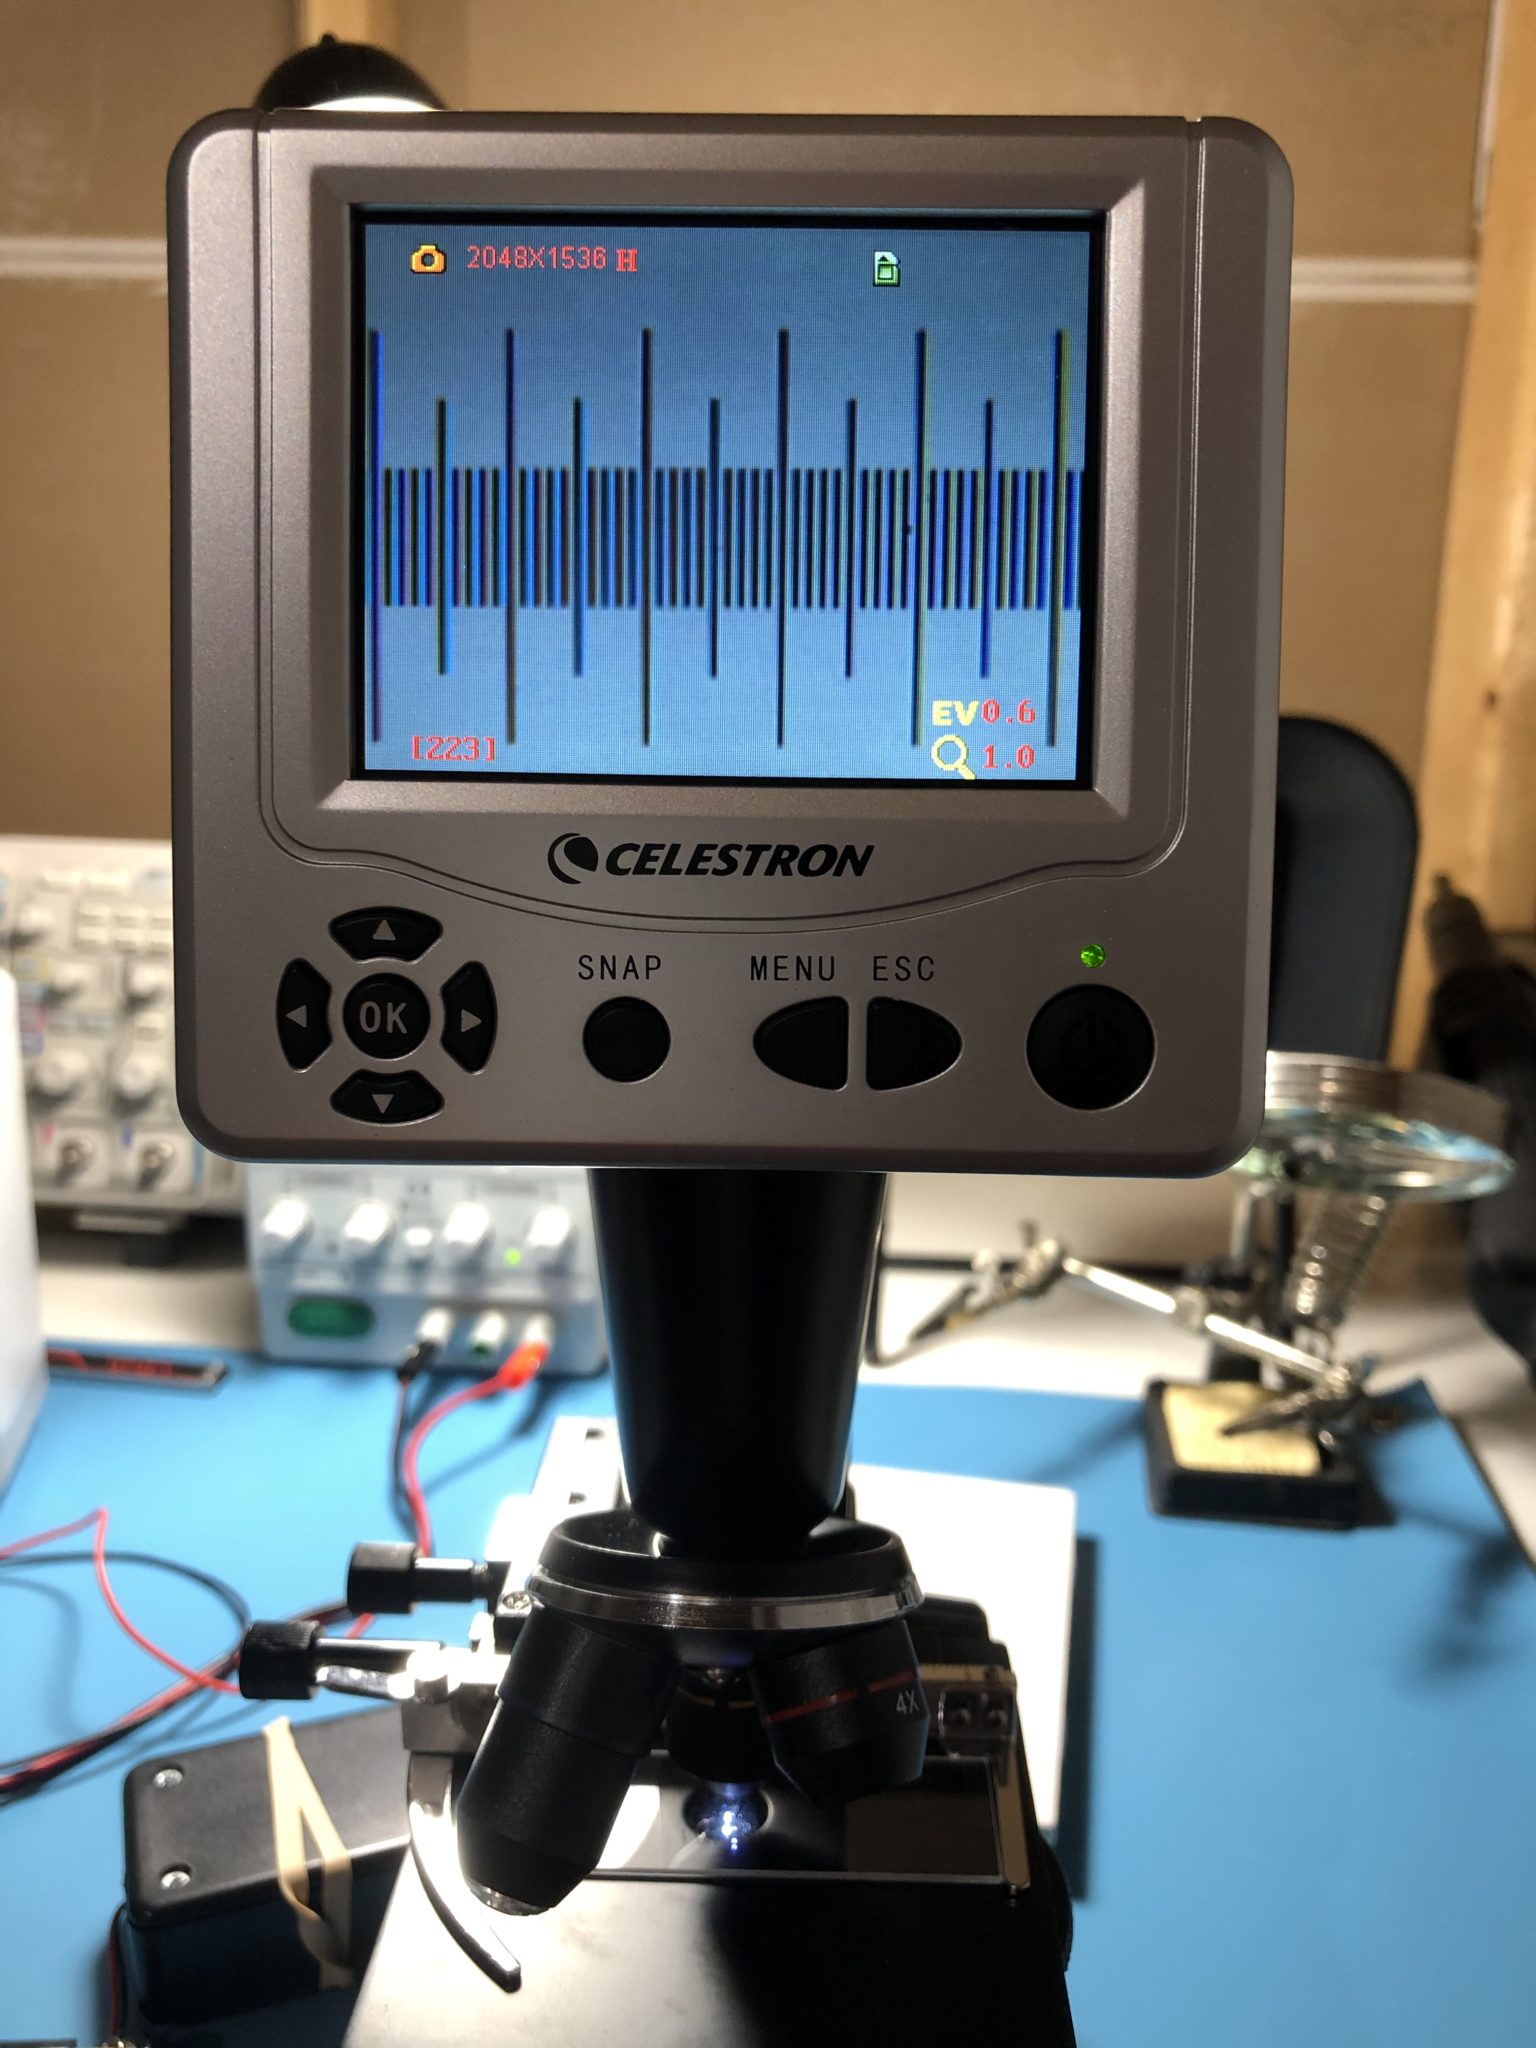
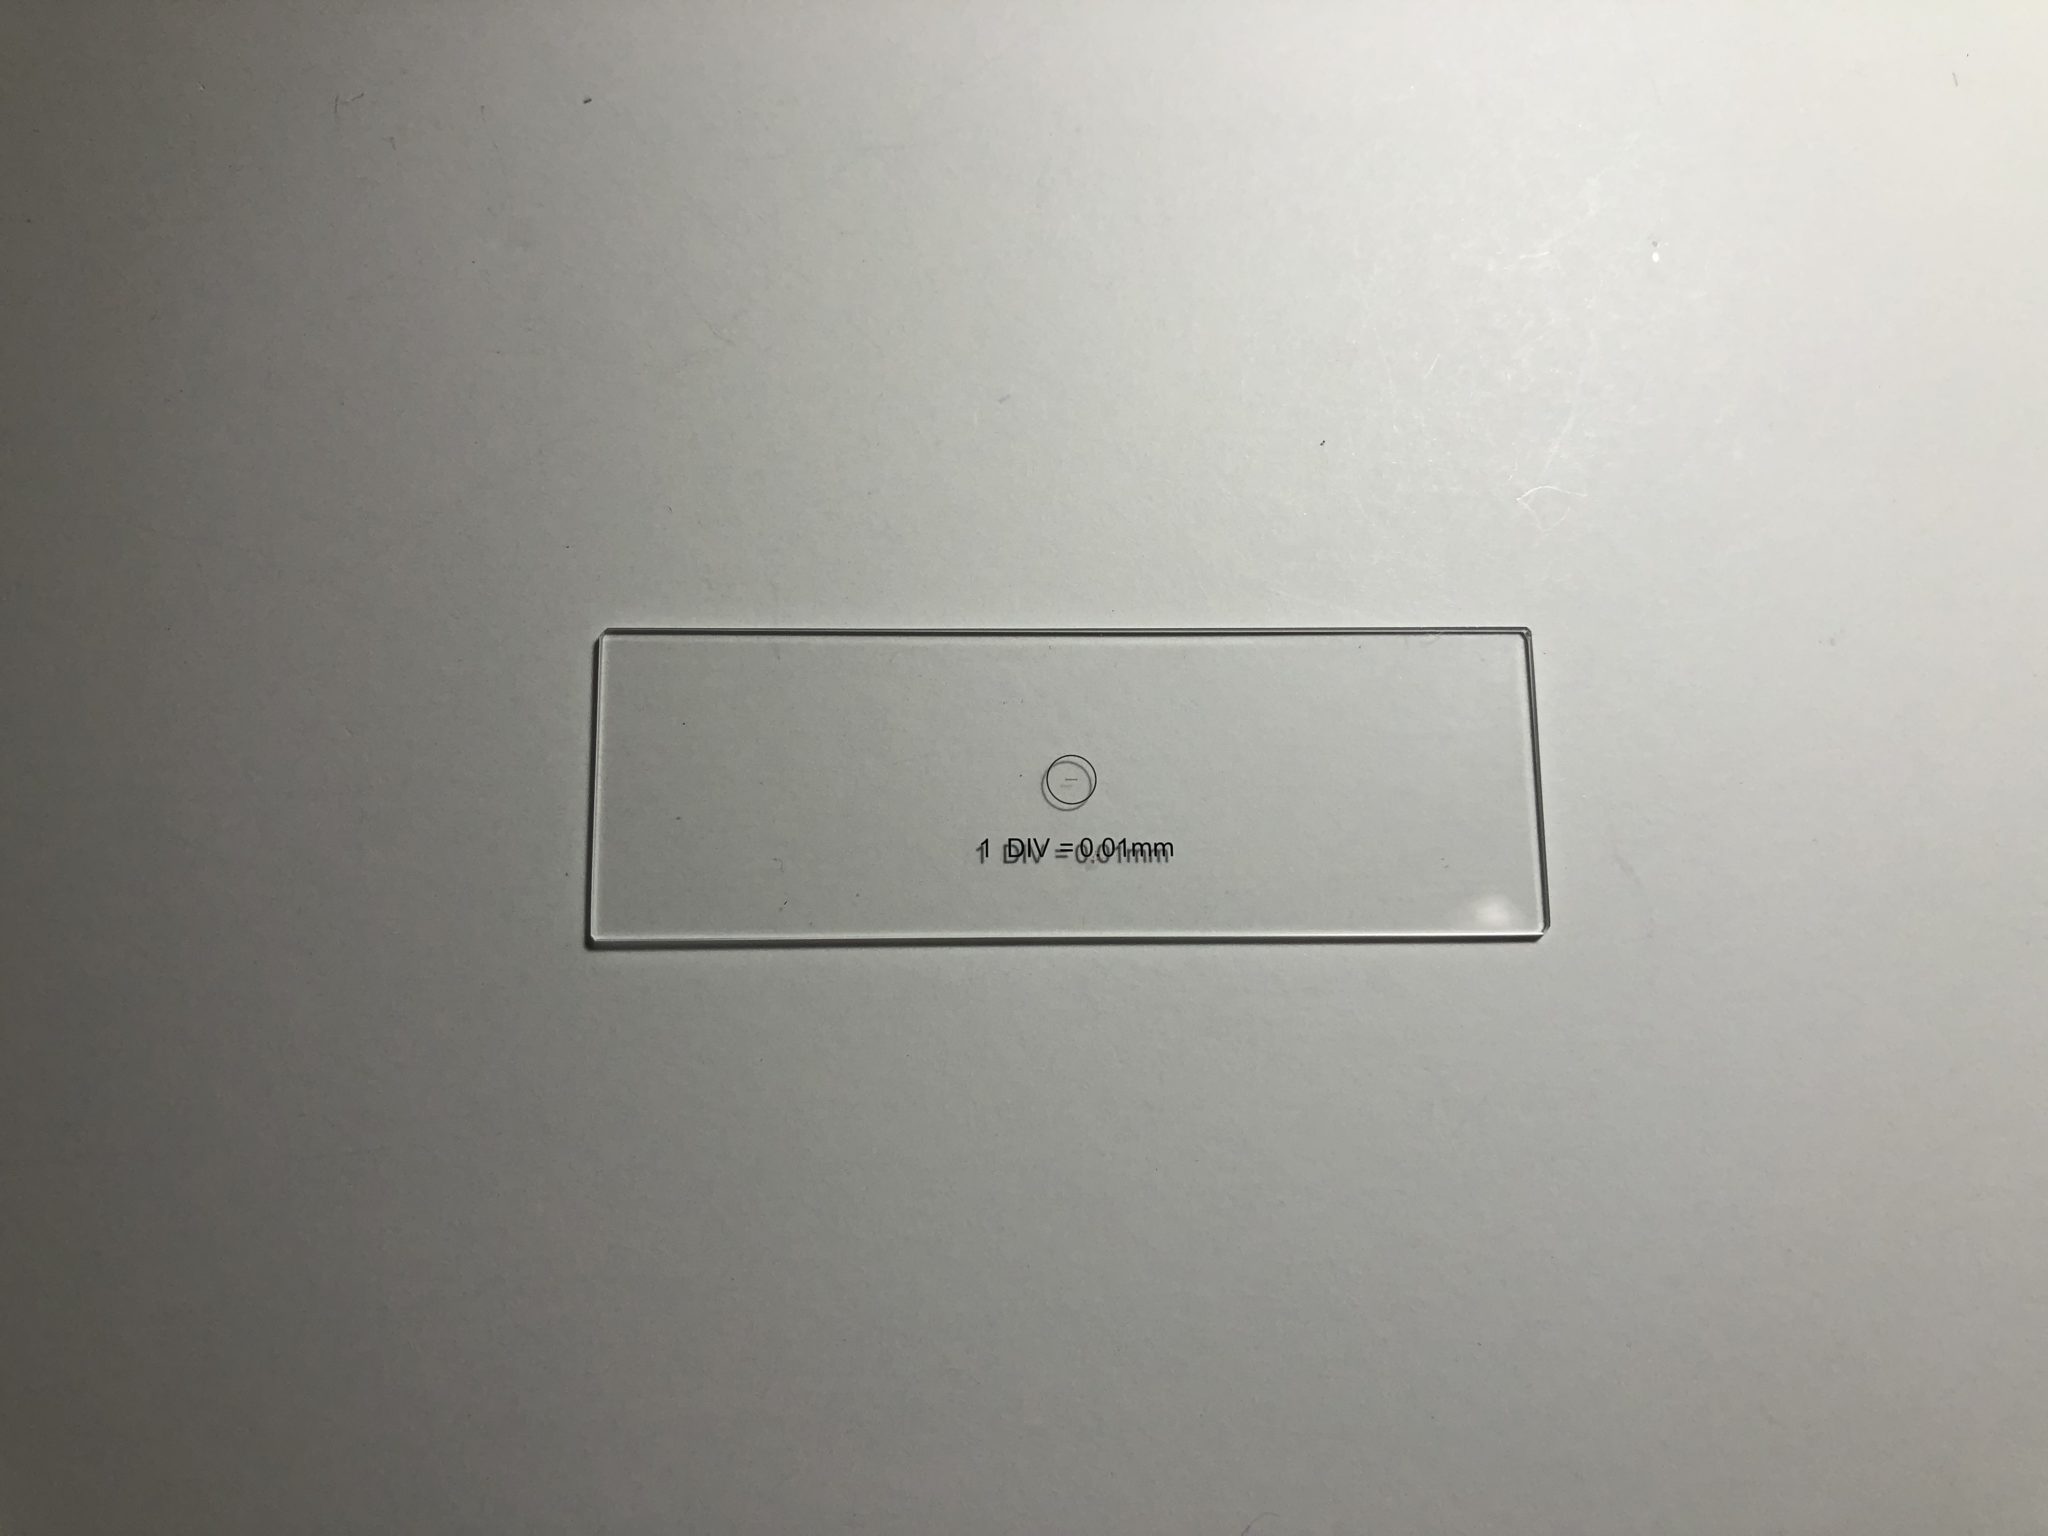
The calibration slide has a bunch of very precise markings spaced 10 μm apart. By taking a picture of this slide and counting pixels, I calculated my microscope’s resolution to be approximately 0.305 μm per pixel, with a 2-megapixel camera and 100x optical magnification. Using this conversion, I calculated the approximate thicknesses of the samples in μm:
| Sample | Pixel Distance | Calculated Thickness |
| Hair | 241 px | 73.5 μm |
| 30 AWG Wrap Wire | 710 px | 216 μm |
| Single Wire Strand | 273 px | 83.23 μm |
| Carpet Fiber | 188 px | 57.3 μm |
| Monofilament | 667 px | 203 μm |
| 3D Printed Plastic | 78 px | 23.8 μm |

Final Results
All together, these were the thicknesses I measured using both the laser and microscope:
| Sample | Thickness (Laser) | Thickness (Microscope) | Difference (% from laser) |
| Hair | 65.0 μm | 73.5 μm | +13.1% |
| 30 AWG Wrap Wire | 206 μm | 216 μm | +4.85% |
| Single Wire Strand | 73.4 μm | 83.23 μm | +13.4% |
| Carpet Fiber | 39.9 μm | 57.3 μm | +43.6% |
| Monofilament | 190.0 μm | 203 μm | +6.8% |
| 3D Printed Plastic | 17.8 μm | 23.8 μm | +33.7% |
Remarks
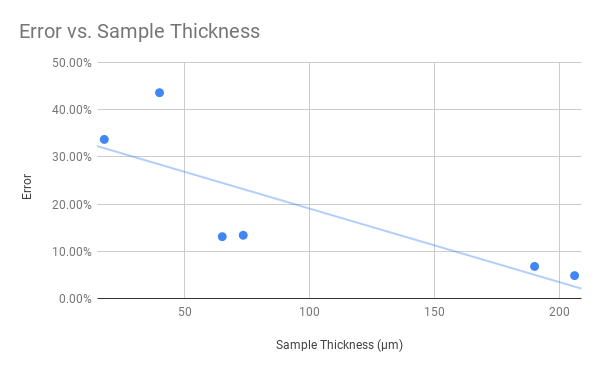
As you can see from the comparison table, some of these values are pretty close. Others…not quite. Furthermore, there seems to be some correlation between sample thickness and error. I believe the most likely cause is the difficulty of measuring large interference patterns–the ones that result from thinner samples. When the interference pattern is very large, it can be hard to pinpoint the exact center of the dark spots in the image. It doesn’t appear to be an issue with the laser itself or the experimental setup, as any deviations from expected values would result in a constant error term.
To mitigate this error, one could repeat the experiment, but instead of measuring the interference pattern, move the board back and forth until the pattern matches a predetermined distance, and then measure the board distance. That would be left as an exercise for the reader.
Extra Credit
For an added challenge, try to do the experiment in reverse! If you have an accurate micrometer (or a microscope), measure the samples first. Then, use the interference pattern to try and estimate the laser’s wavelength. Even better, try it with lasers of different wavelengths! (hint: a green laser is about 532 nm)
Tried this experiment? Post your observations below!