LEDs (Light-Emitting Diodes) light up our modern world. Everything from status indicators, to displays, and even…well, lighting, uses LEDs of all colors, shapes, and sizes. As we’ve explored in a previous experiment, one thing that determines an LED’s color is the material properties of the silicon it’s made of. In this lab, we’ll explore these properties and find out how they relate to the LED’s color.
Background
Light-Emitting Diodes, as their name suggests, are just like regular diodes in that current can flow through them in only one direction. This is because they’re made up of two different kinds of semiconductors pressed together. We’ll call them N-Type and P-Type. N-Type materials are negatively-charged because they have extra electrons, while P-Types are positively-charged because they are missing electrons (they have “holes”). When current is applied, electrons flow from N-Type to P-Type and get attracted to the holes. These flowing electrons have a pretty high energy, and when they get “captured” by the holes, which are at a lower energy level, they have to give up some of that energy. In LEDs, that energy happens to be released in the form of light. The bigger the energy difference (known as the band gap), the more energy the electron has to release, and the shorter the wavelength of light [1].
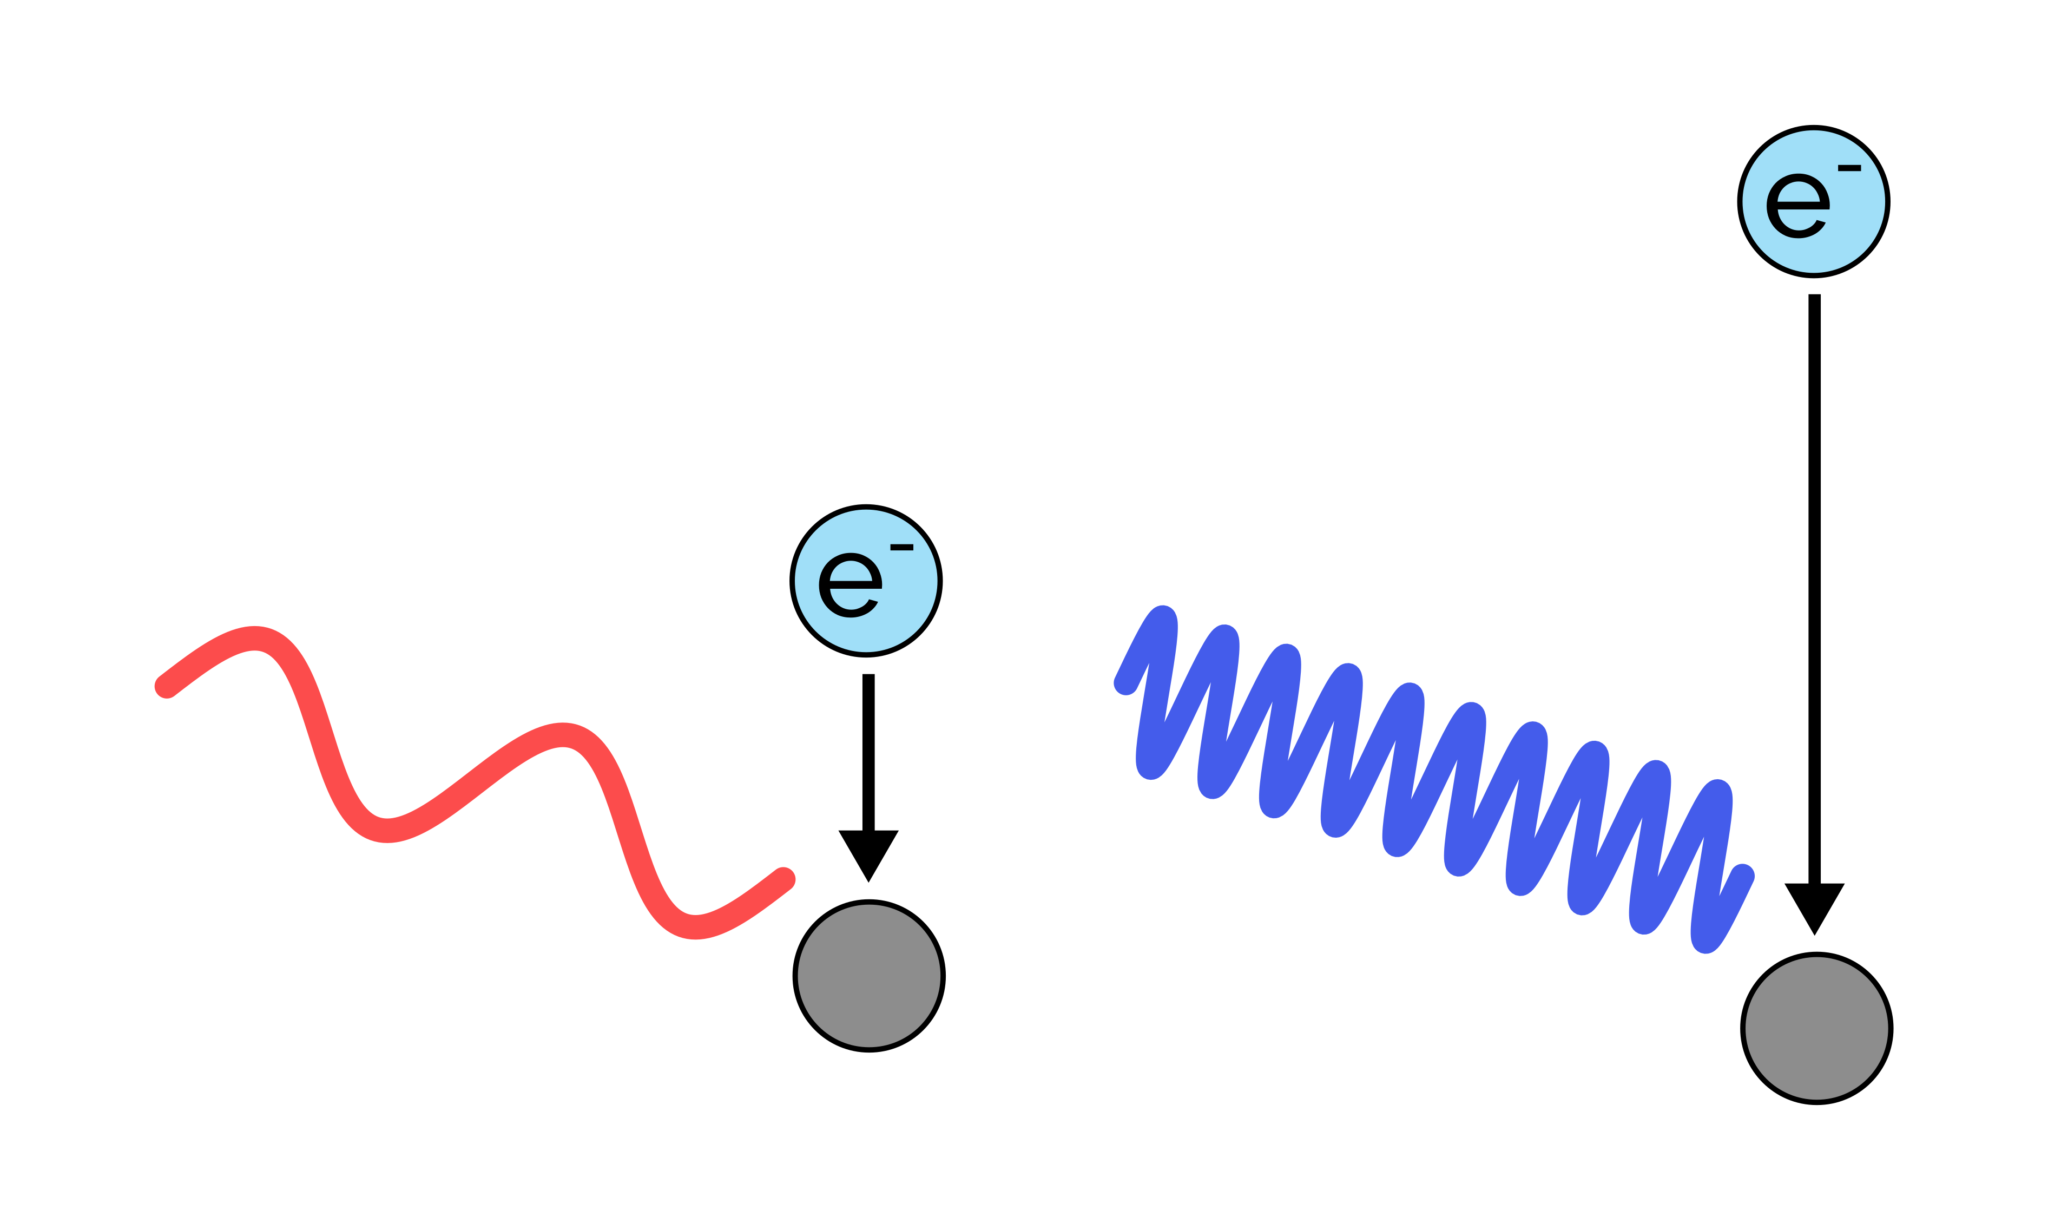
Imagine you’re on a ladder dropping tennis balls into a bucket of water (please be careful). The higher up you are on the ladder, the bigger the “splash” you’ll make. This is essentially what determines LED color. With red LEDs (with low-energy, long wavelength light) you’re dropping tennis balls from the first couple of rungs. With blue LEDs (with high-energy, short wavelength light), you’re dropping them from near the top (again, please be safe up there). The height you drop the tennis balls at is the band gap.
The voltage we apply to get an LED to glow is proportional to the energy level of the electrons flowing through it. By measuring this voltage, we can estimate how much energy the electrons are dropping as they pass through. (It’s not exact, but pretty close)
Safety
- LEDs are fickle beasts. They’re quite sensitive and can blow up if you give them too much current (personal experience talking here). Be sure to carefully regulate their current and double-check your wiring.
- Some LEDs can be very bright, even at low currents. While they’re likely safe to look at, try not to stare directly into them.
Lab Options
This is a special experiment designed to accommodate labs with limited equipment. We’ve created two versions of this experiment based on available equipment/supplies in your lab:
Although the procedures and materials are different, the end result is exactly the same. However, one might be easier depending on the equipment available in your lab.
Lab A: Materials
- Handheld Multimeter
- Anything that can measure voltage down to 0.01V will be fine.
- 100Ω Resistor
- 10kΩ Potentiometer
- 9V Battery and Leads
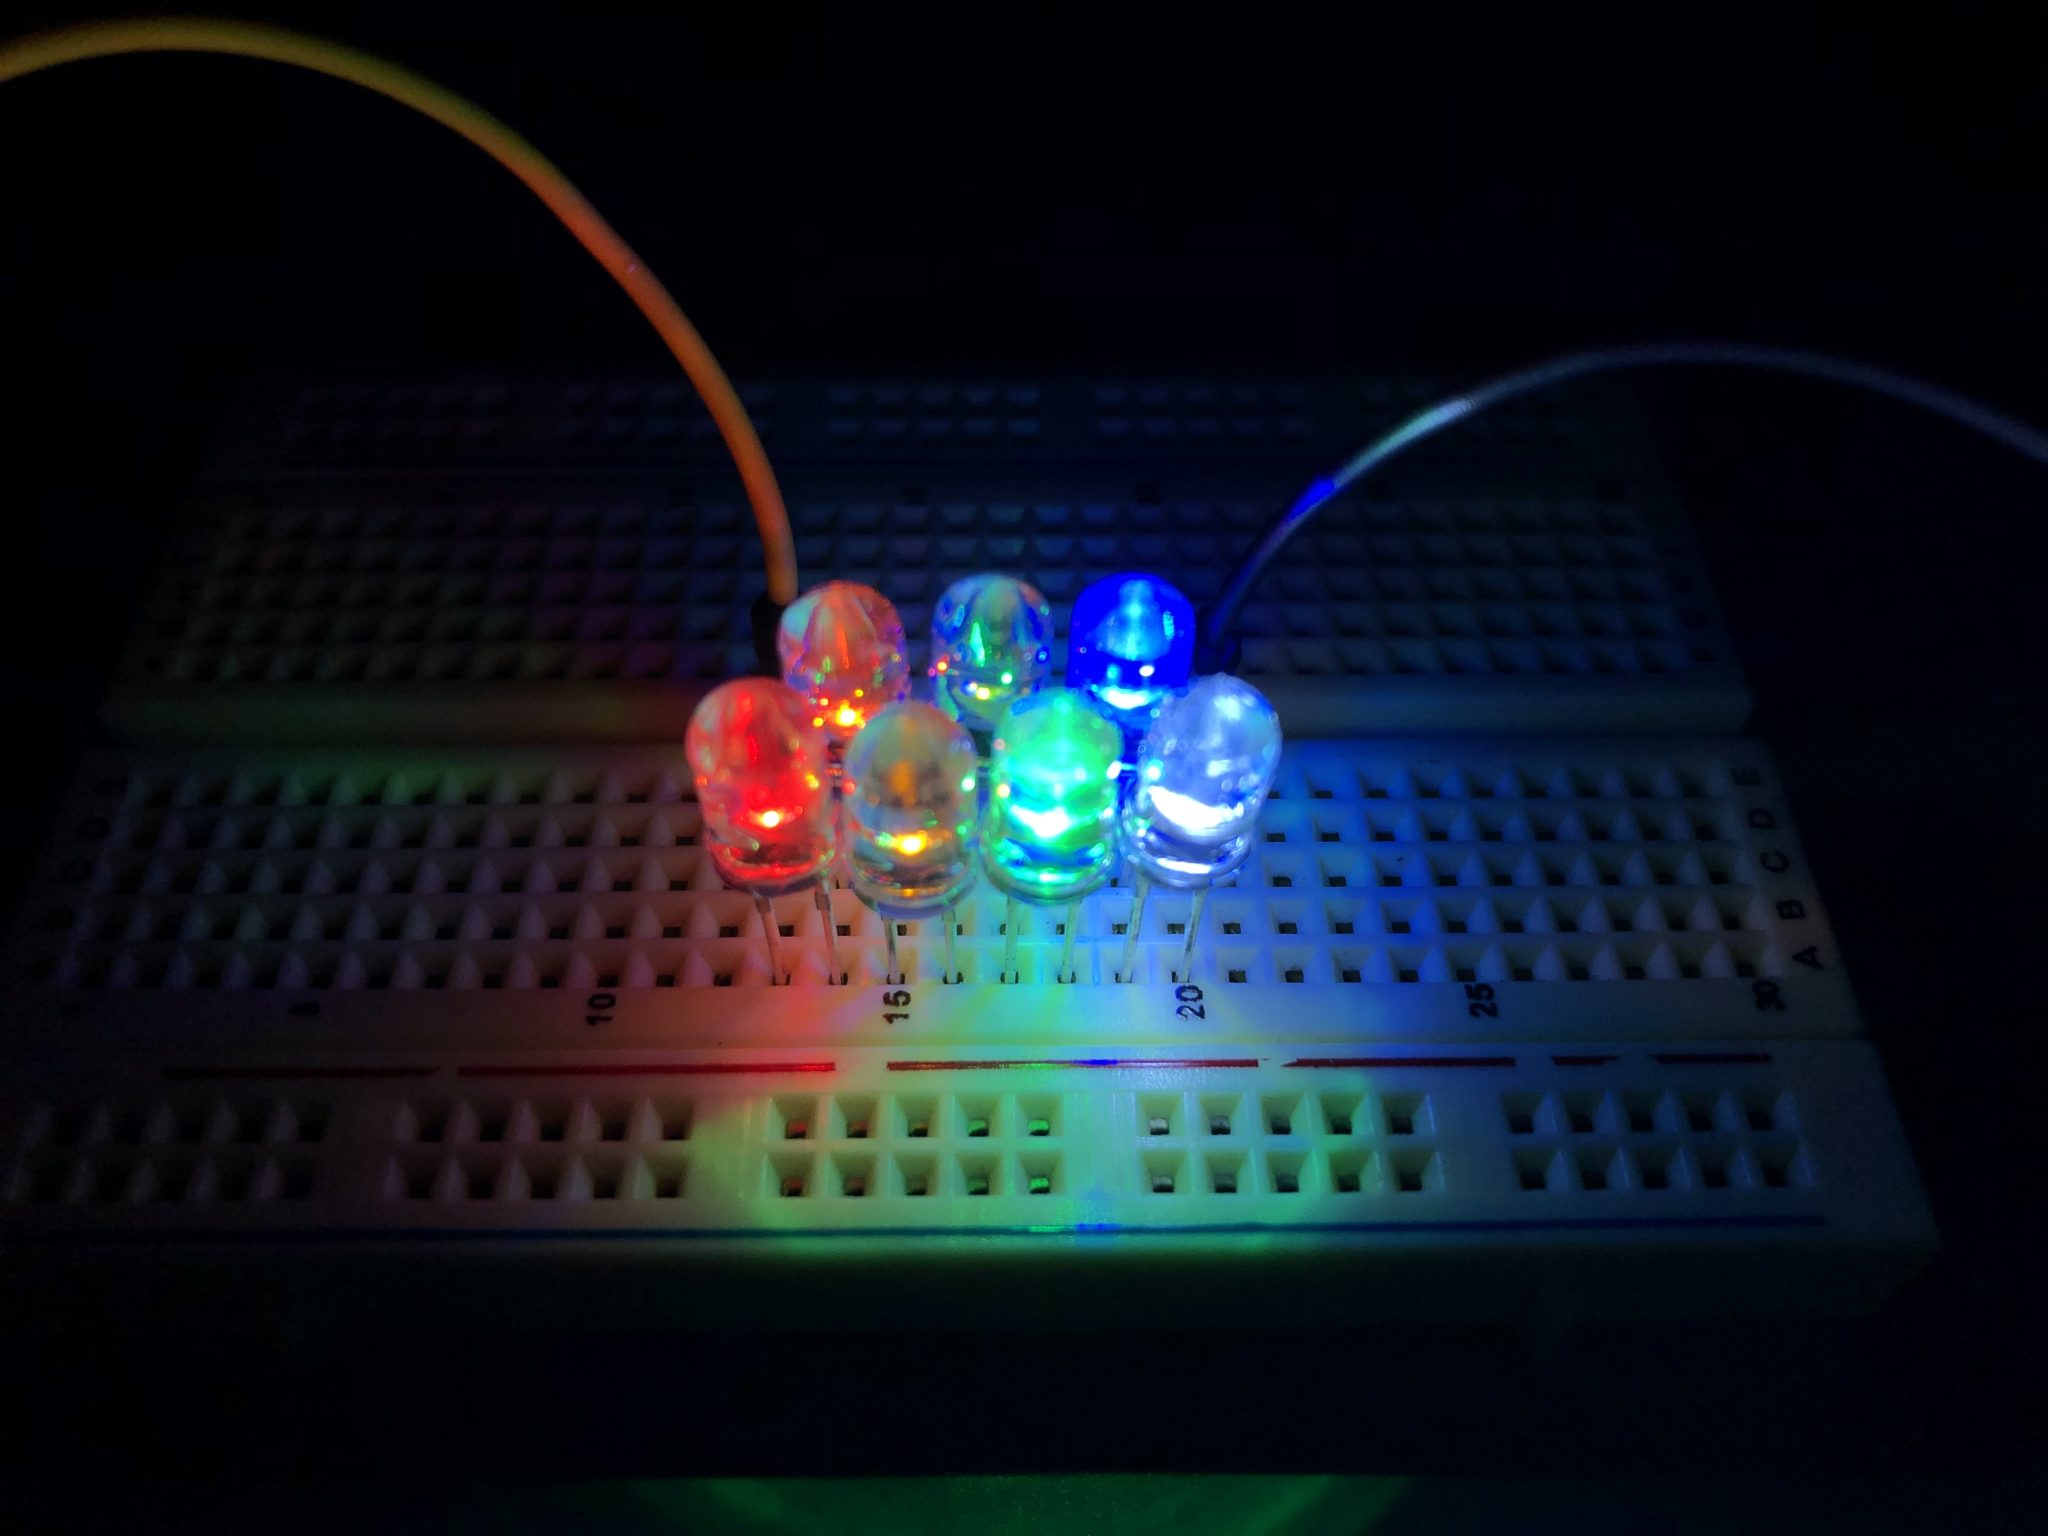
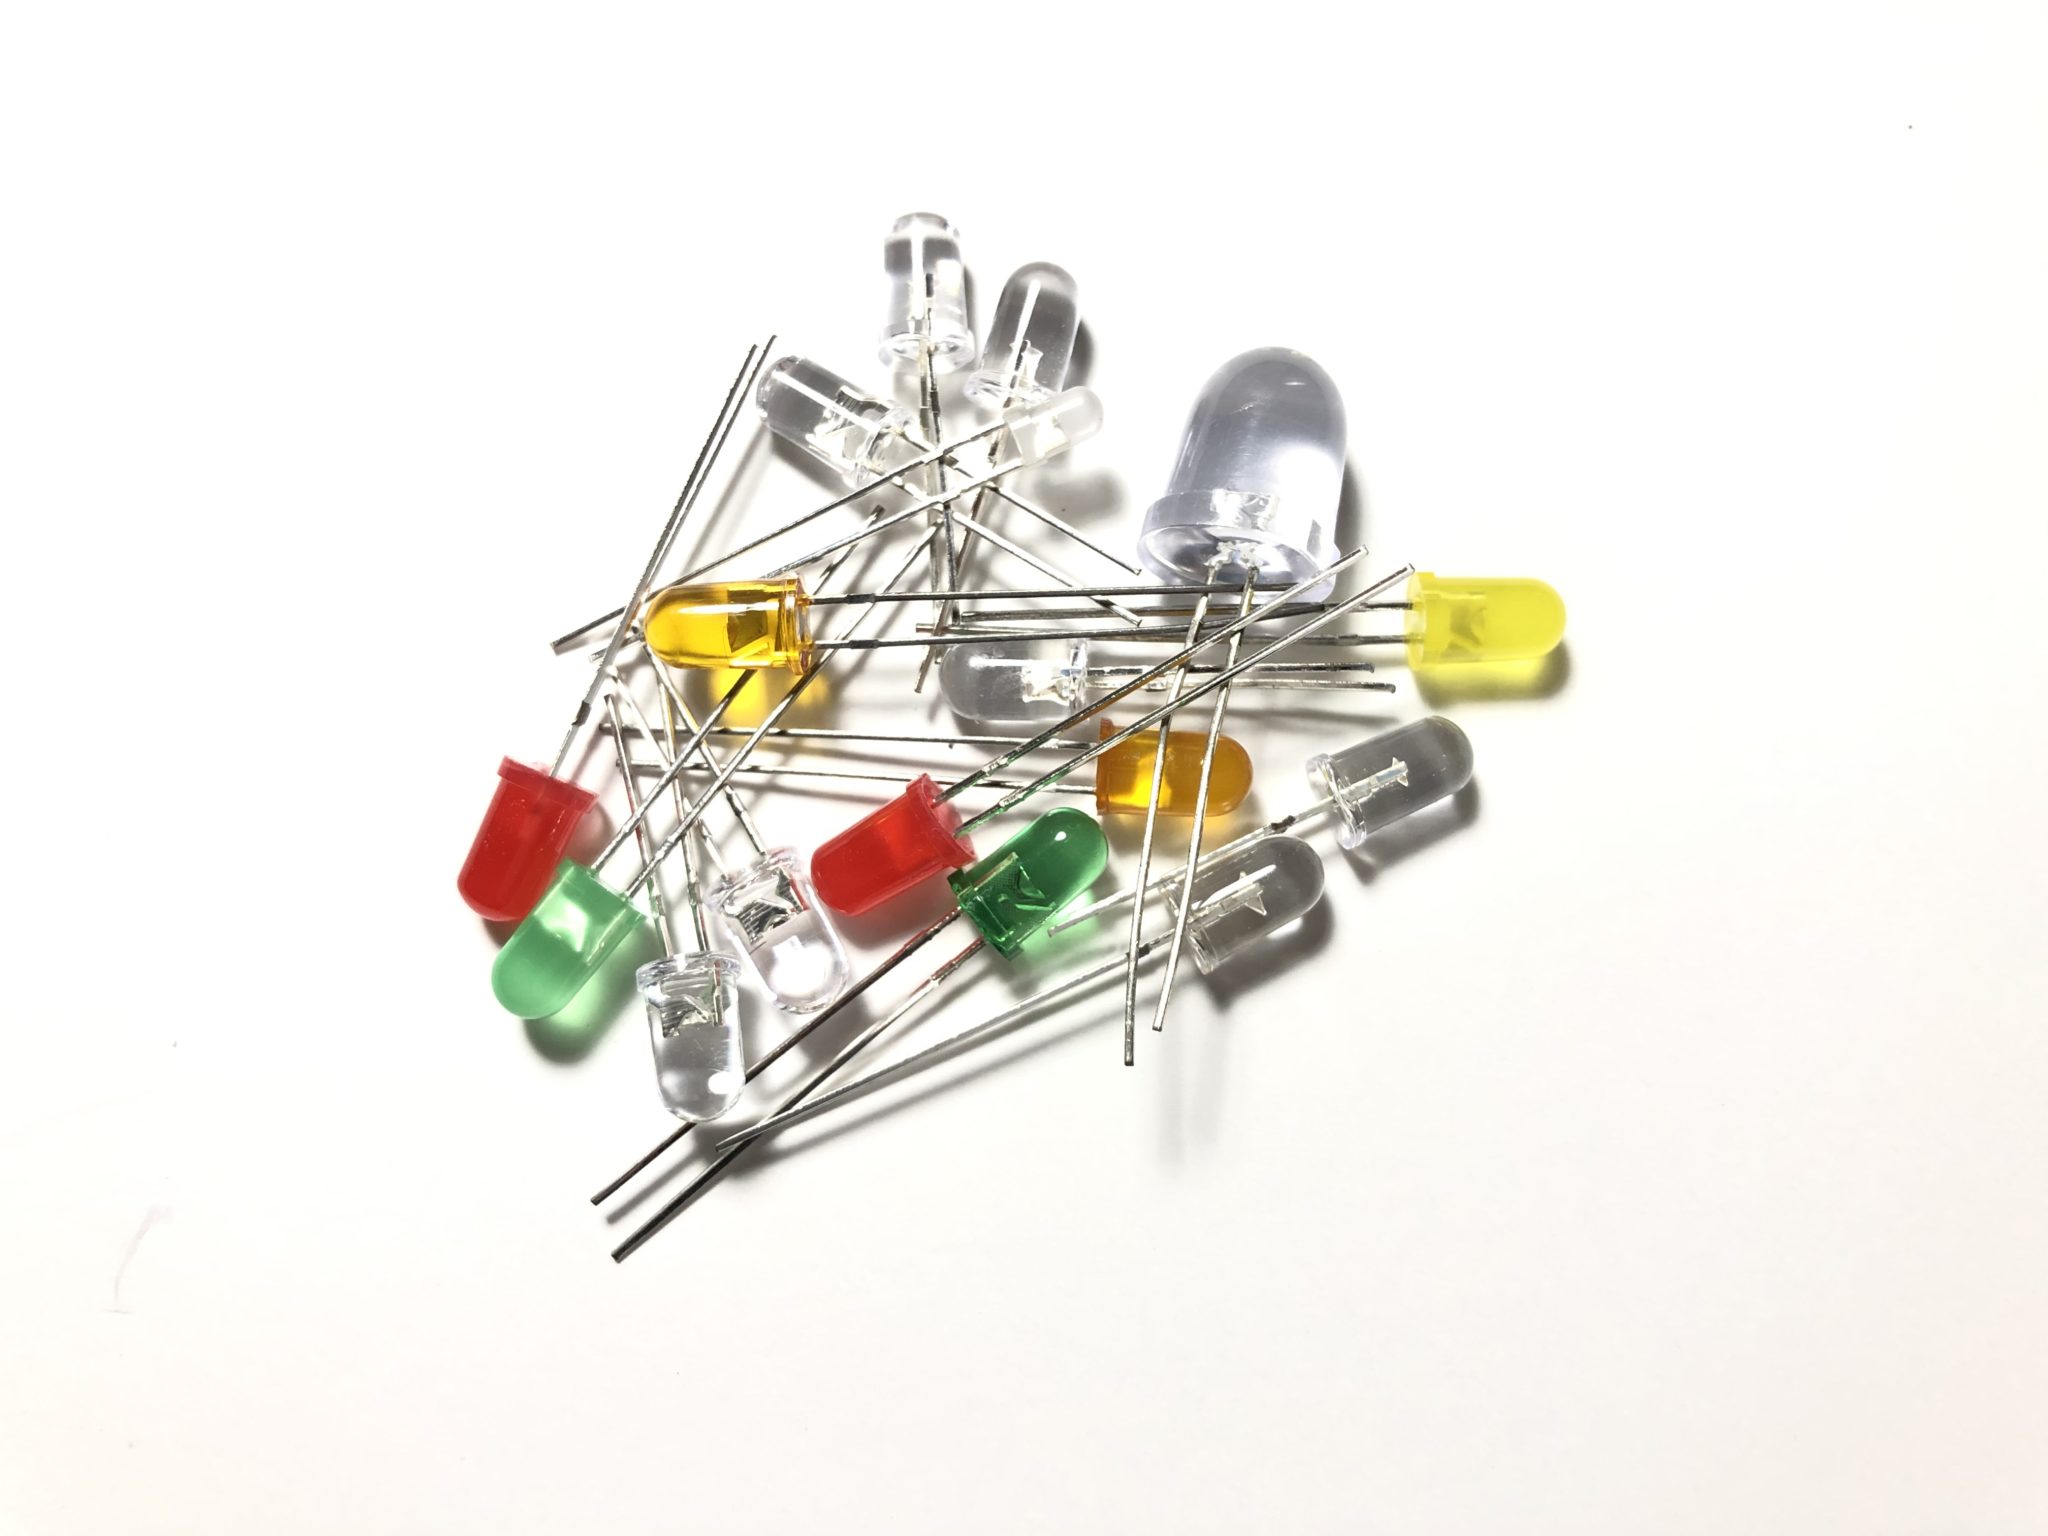
- Various LEDs
- Preferably, you’ll want at least a Red, Green, and Blue LED.
Lab A: Procedure
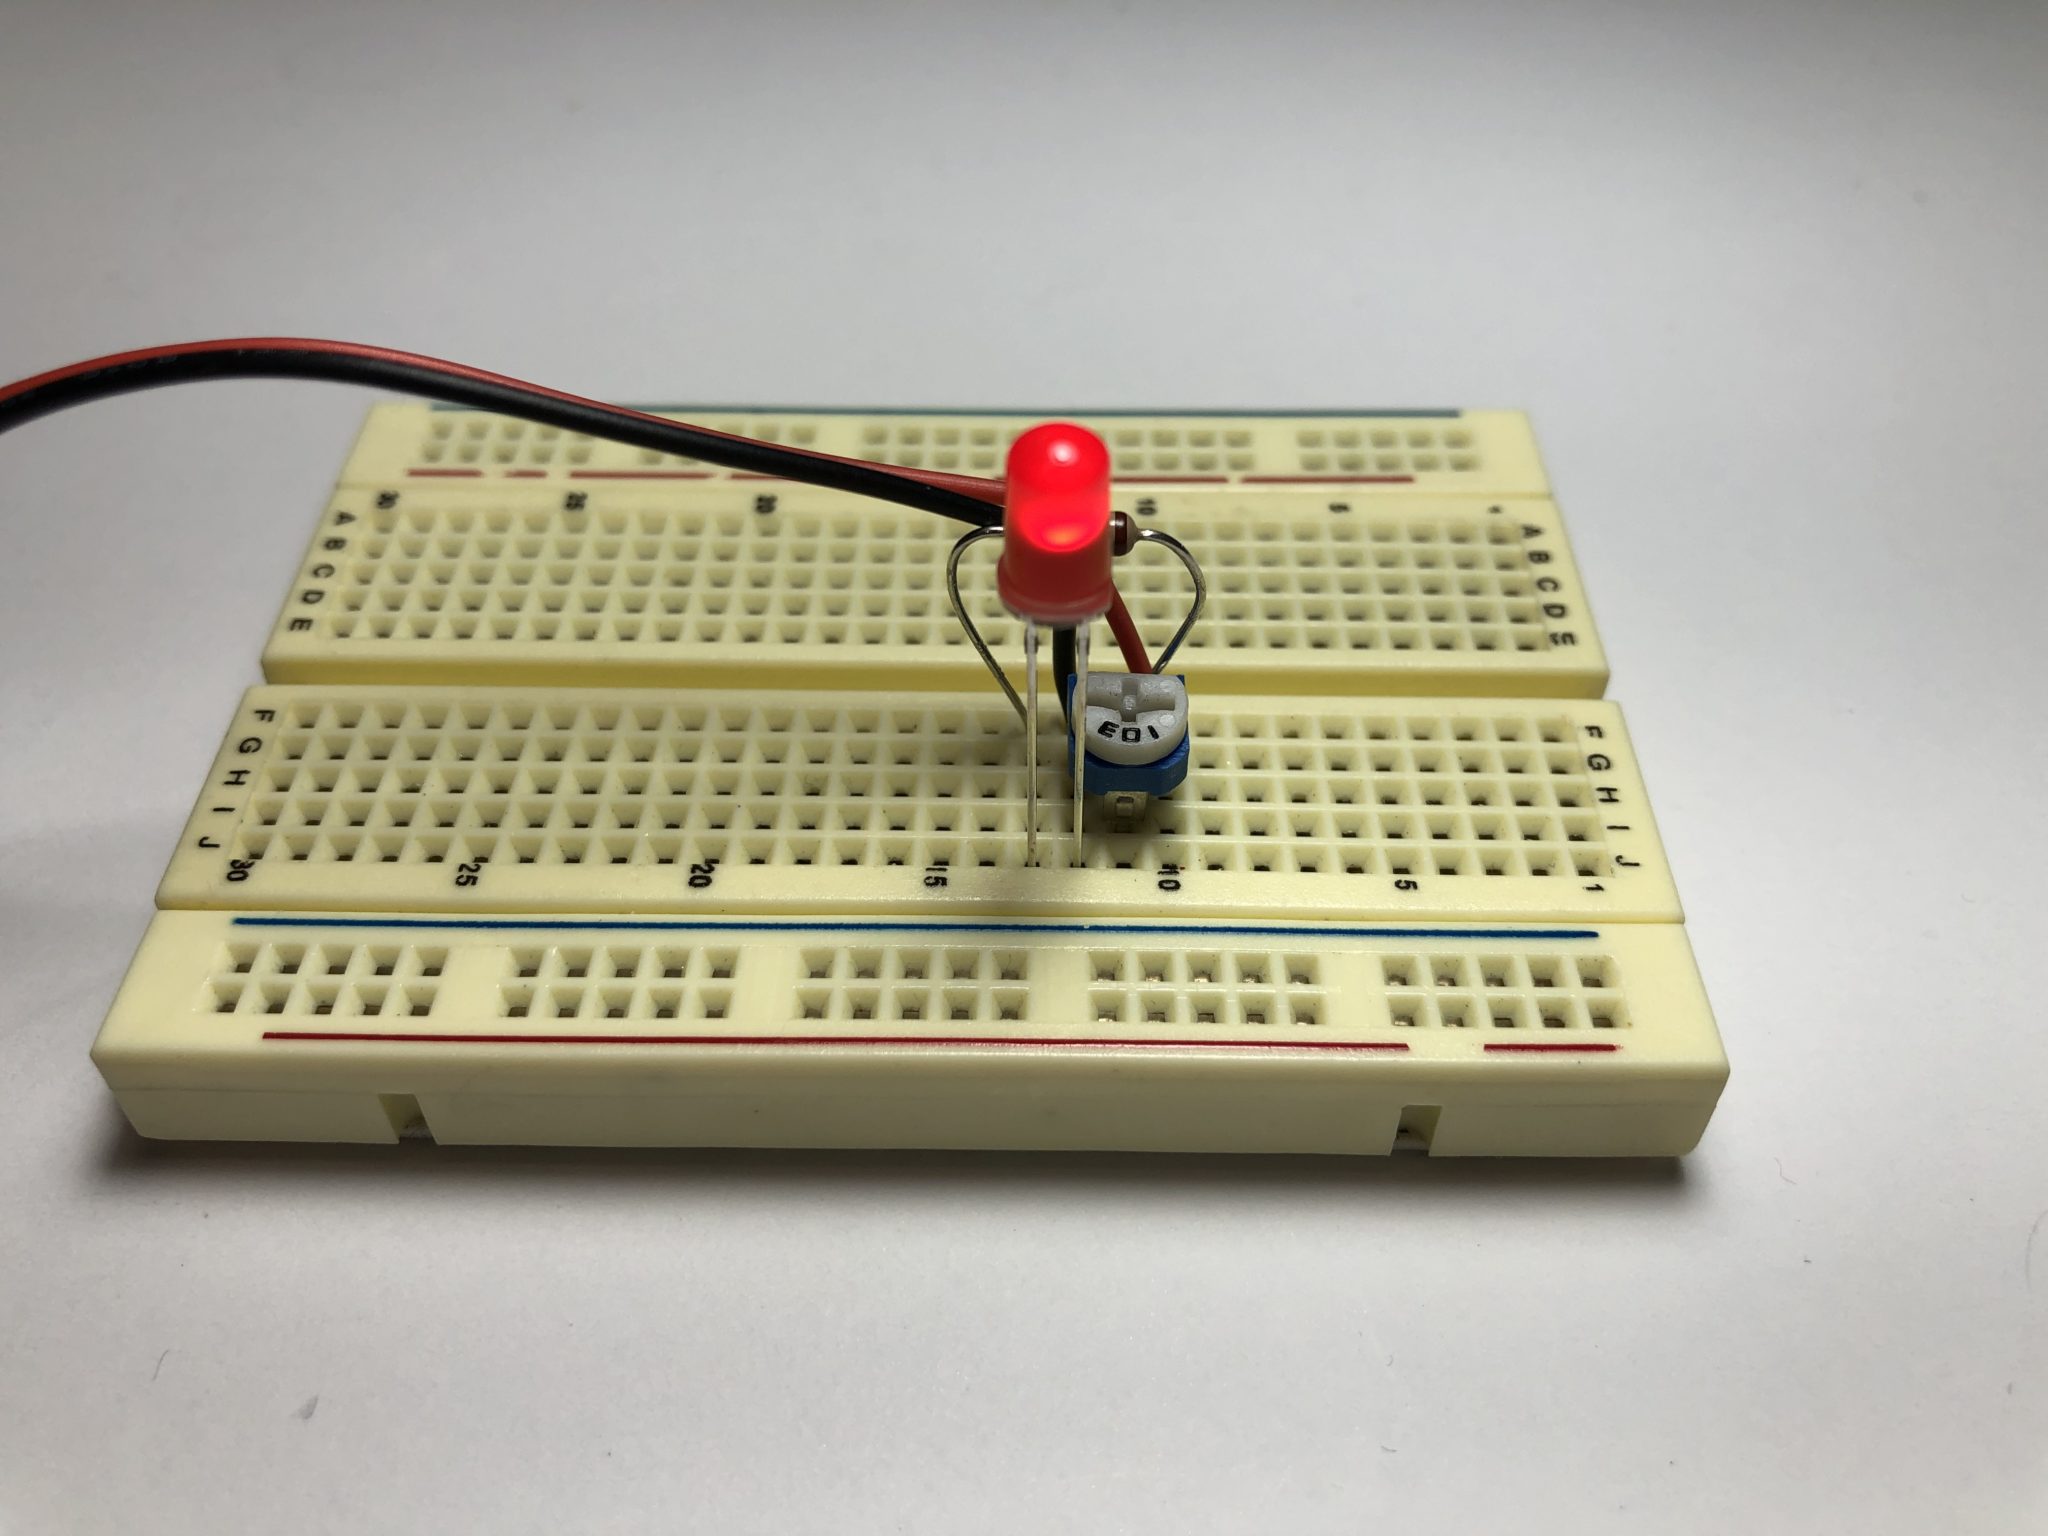
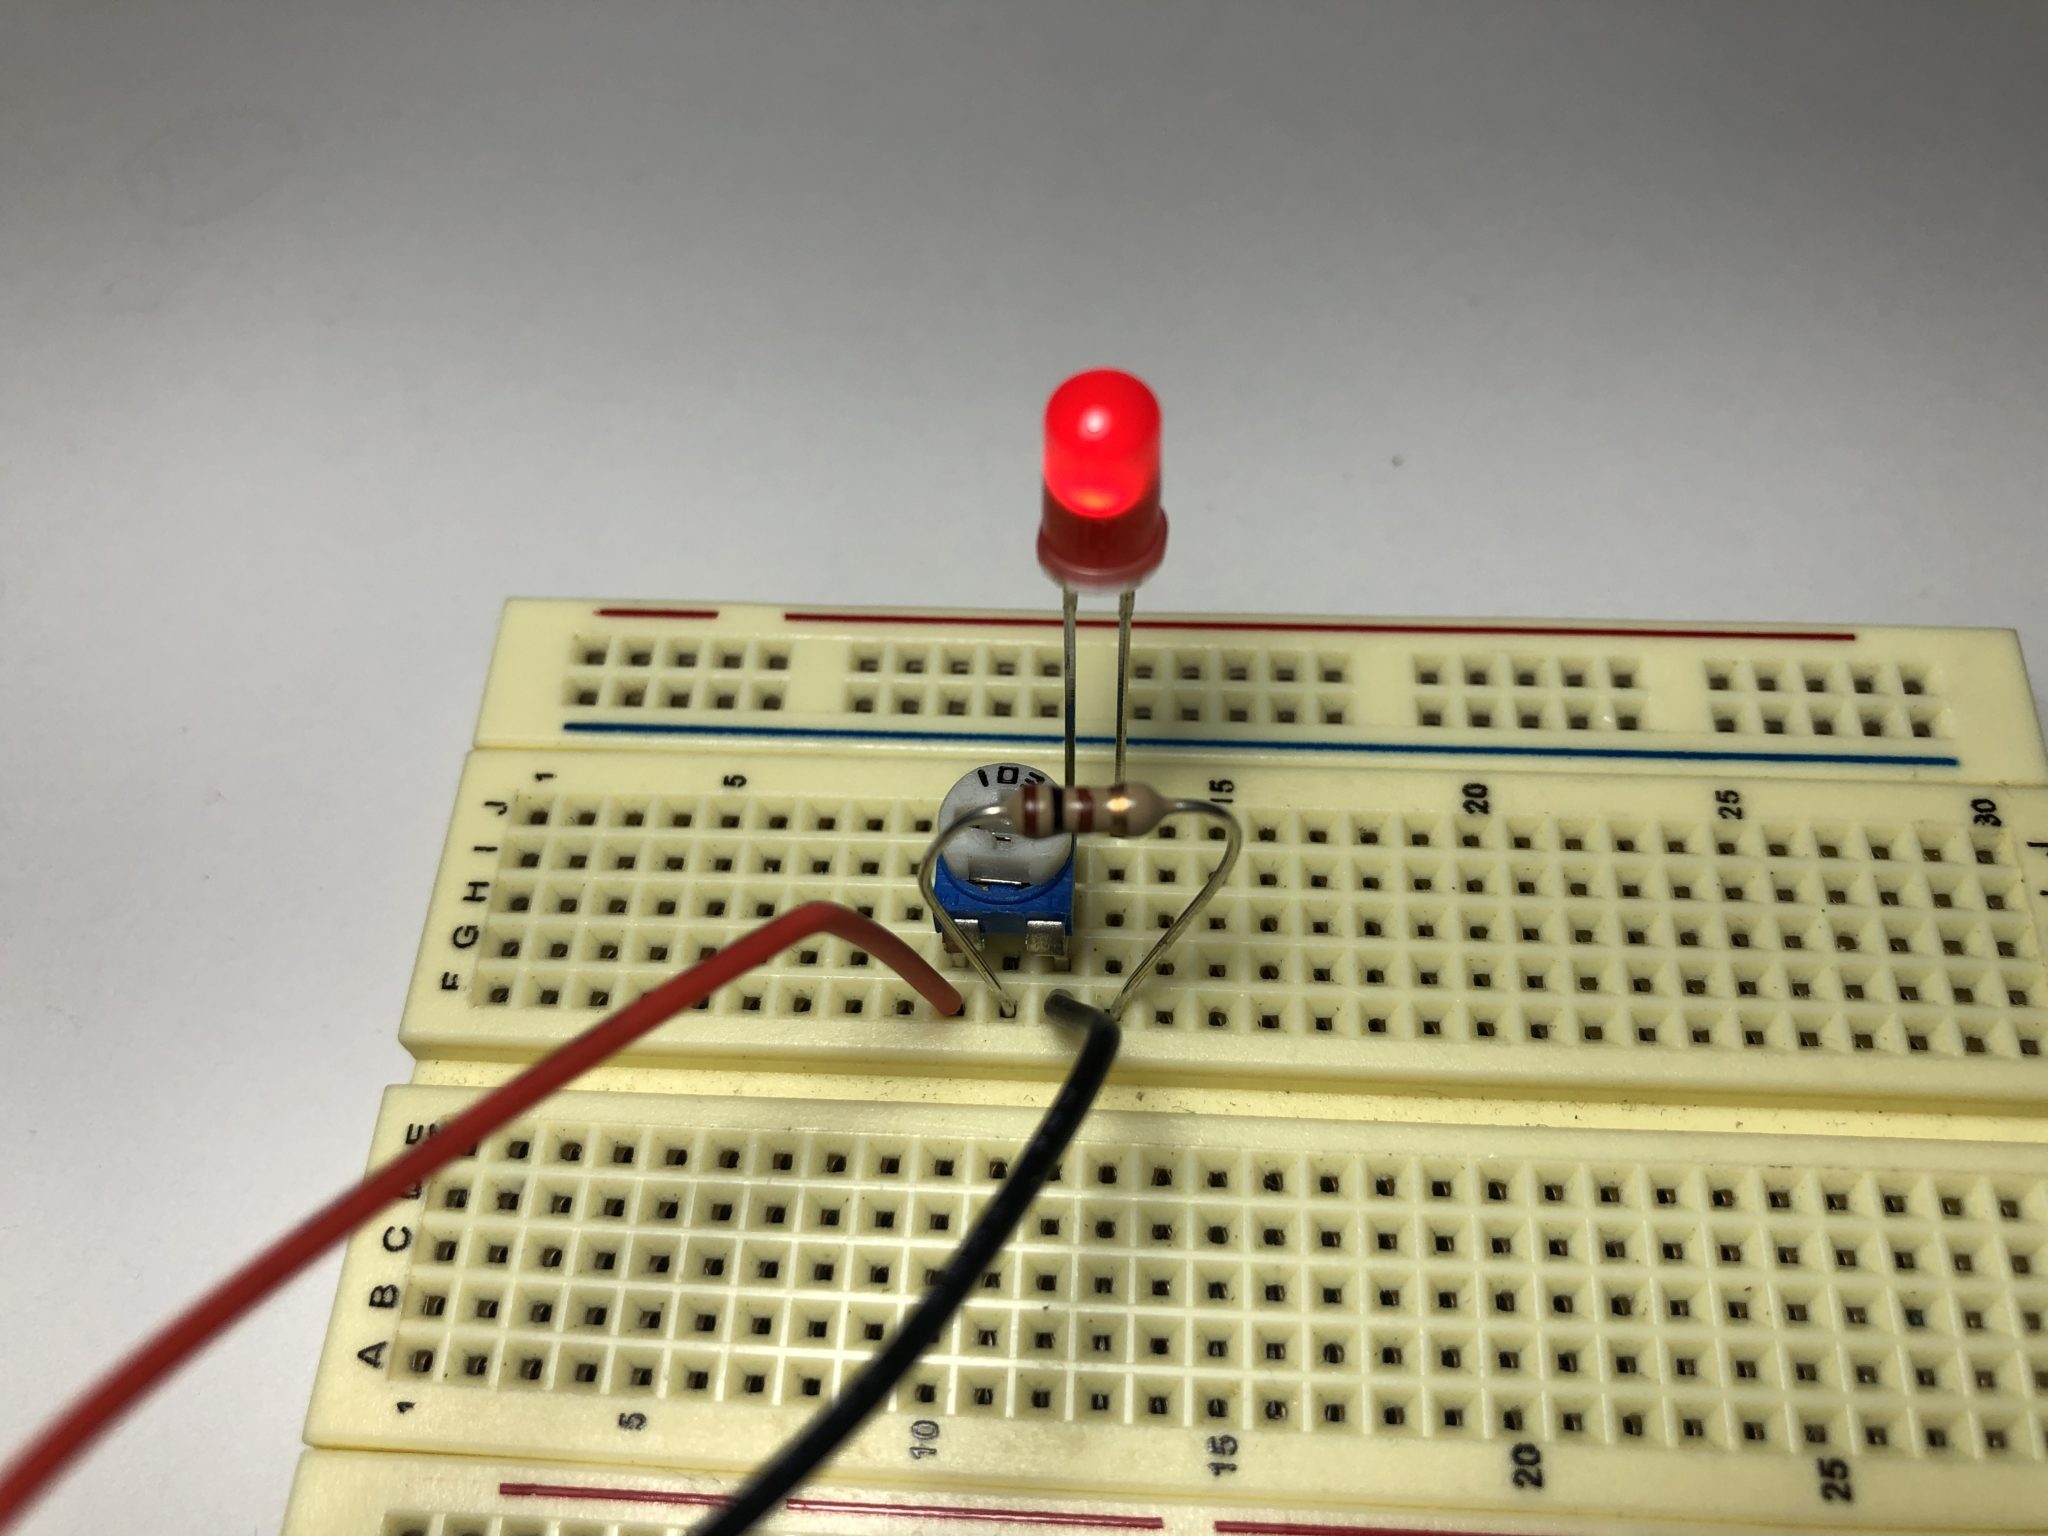
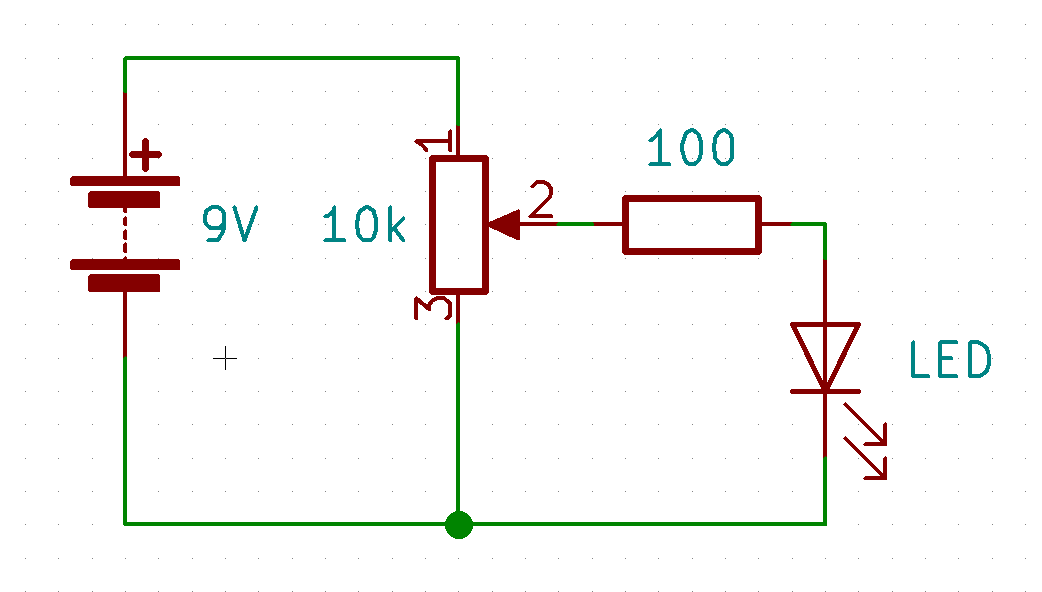
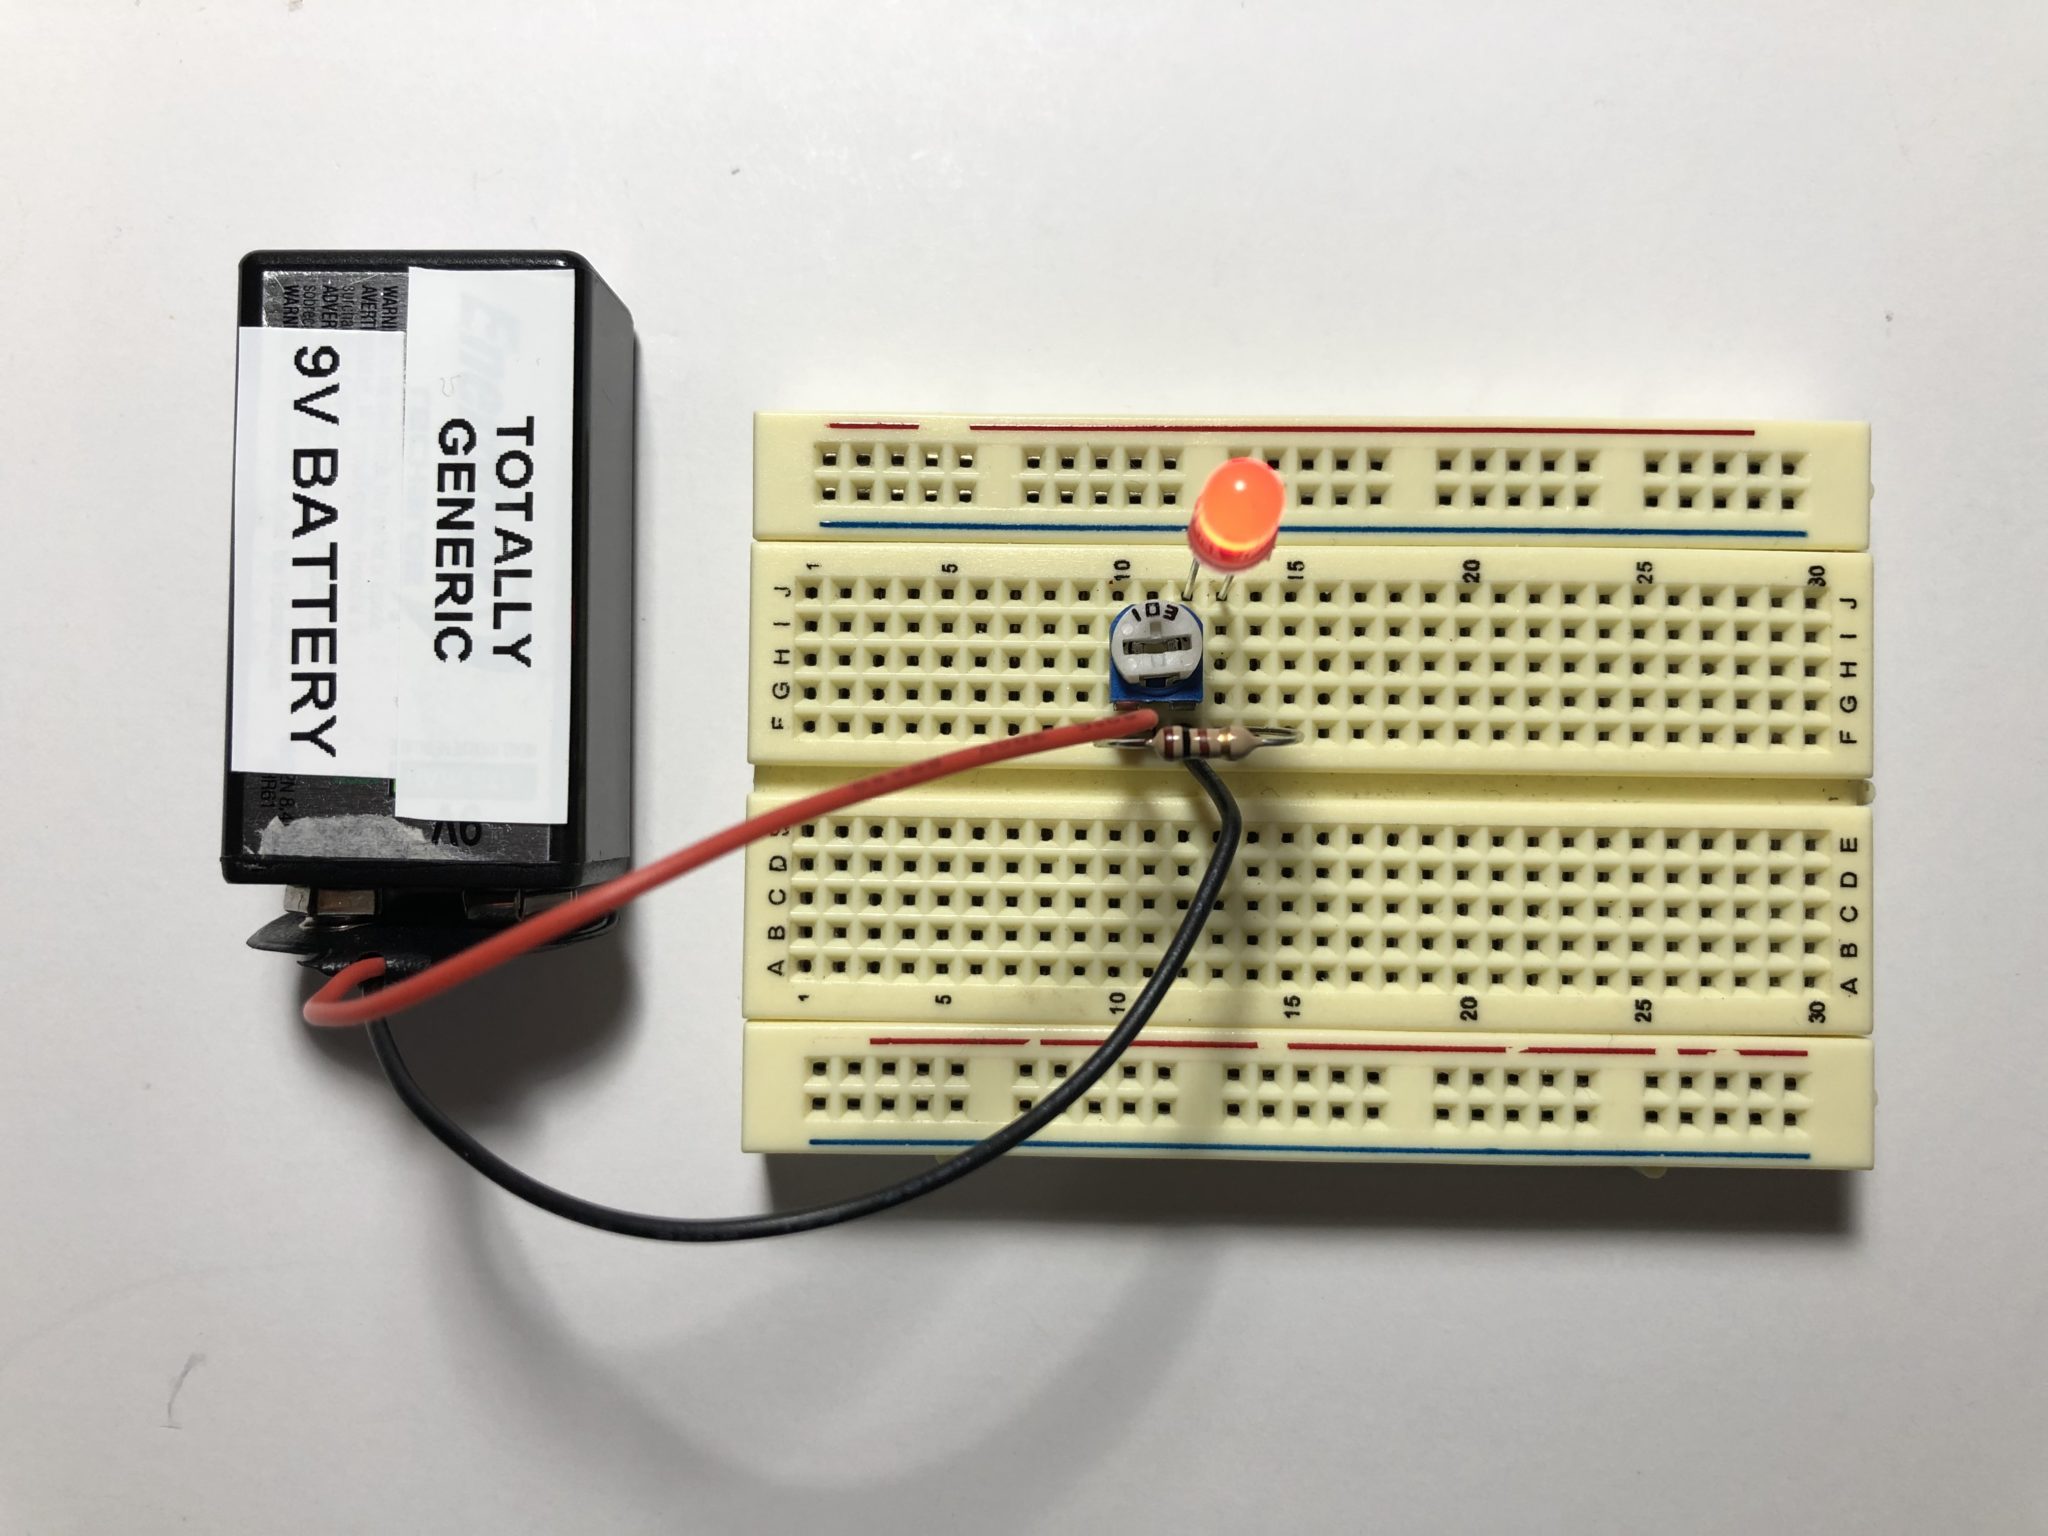
- Build the following circuit. Don’t put the battery in yet. (click on the photos to enlarge):
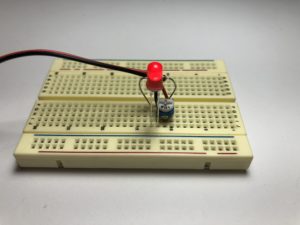
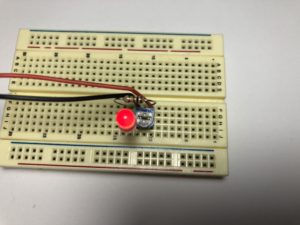

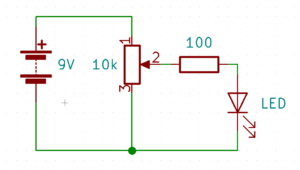
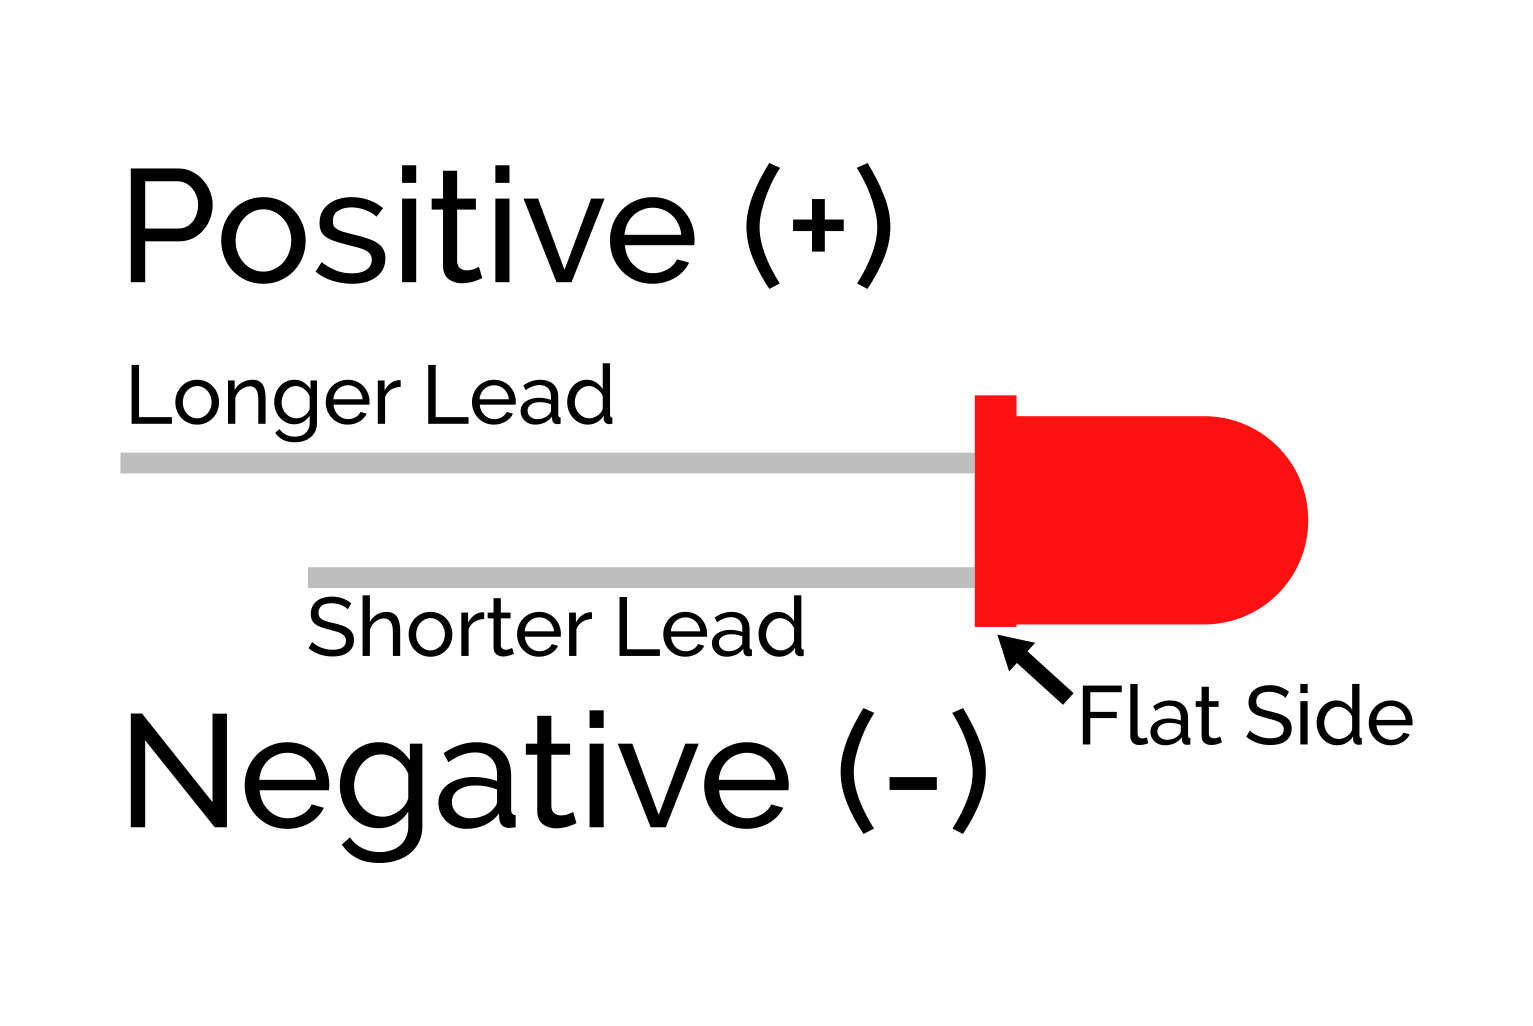
- Make sure you have the LED the right way around.
- Turn the potentiometer so that the numbers on the top are facing the negative wire of your battery. (on mine, I turned it all the way to the right)
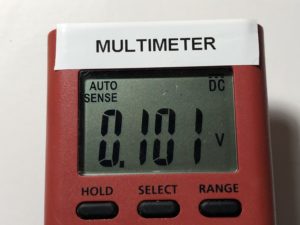
- If you have a different potentiometer, it might work differently. Take out the LED and plug in the battery. Place the multimeter probes on the negative wire of the battery and one of the legs of the resistor. Turn the potentiometer until the meter shows zero volts. Then put the LED back in.
-
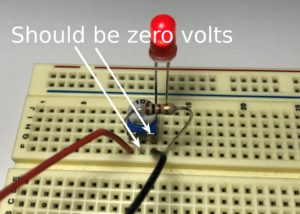
(remove the LED first) - Remember which way the potentiometer is facing when the meter reads zero volts.
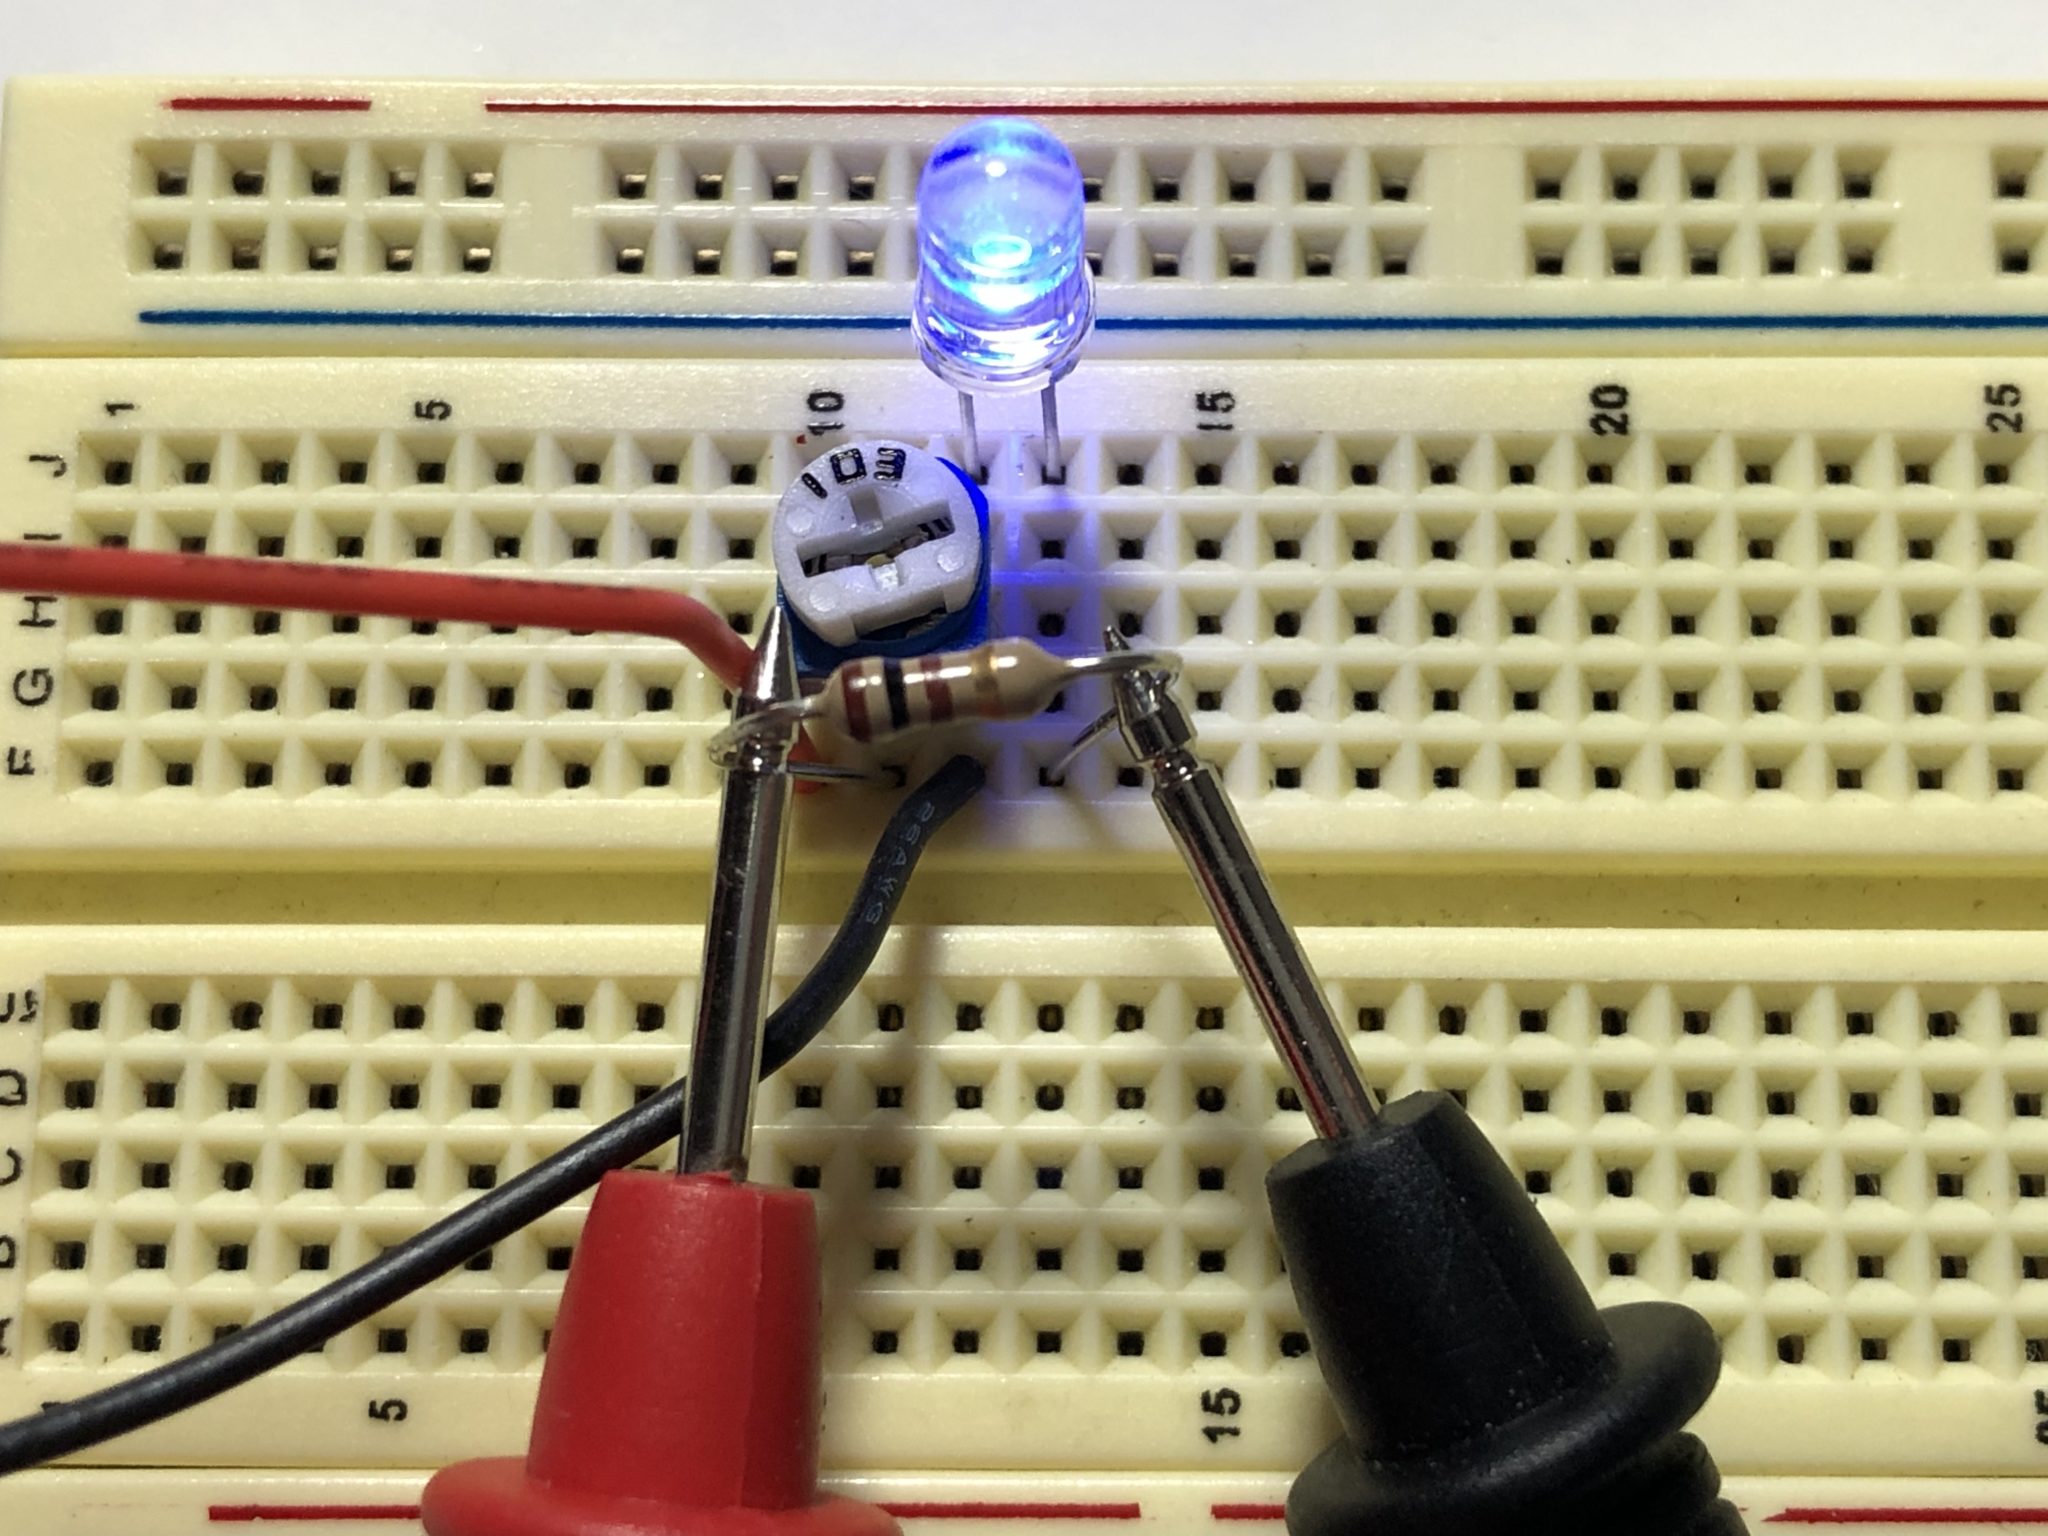
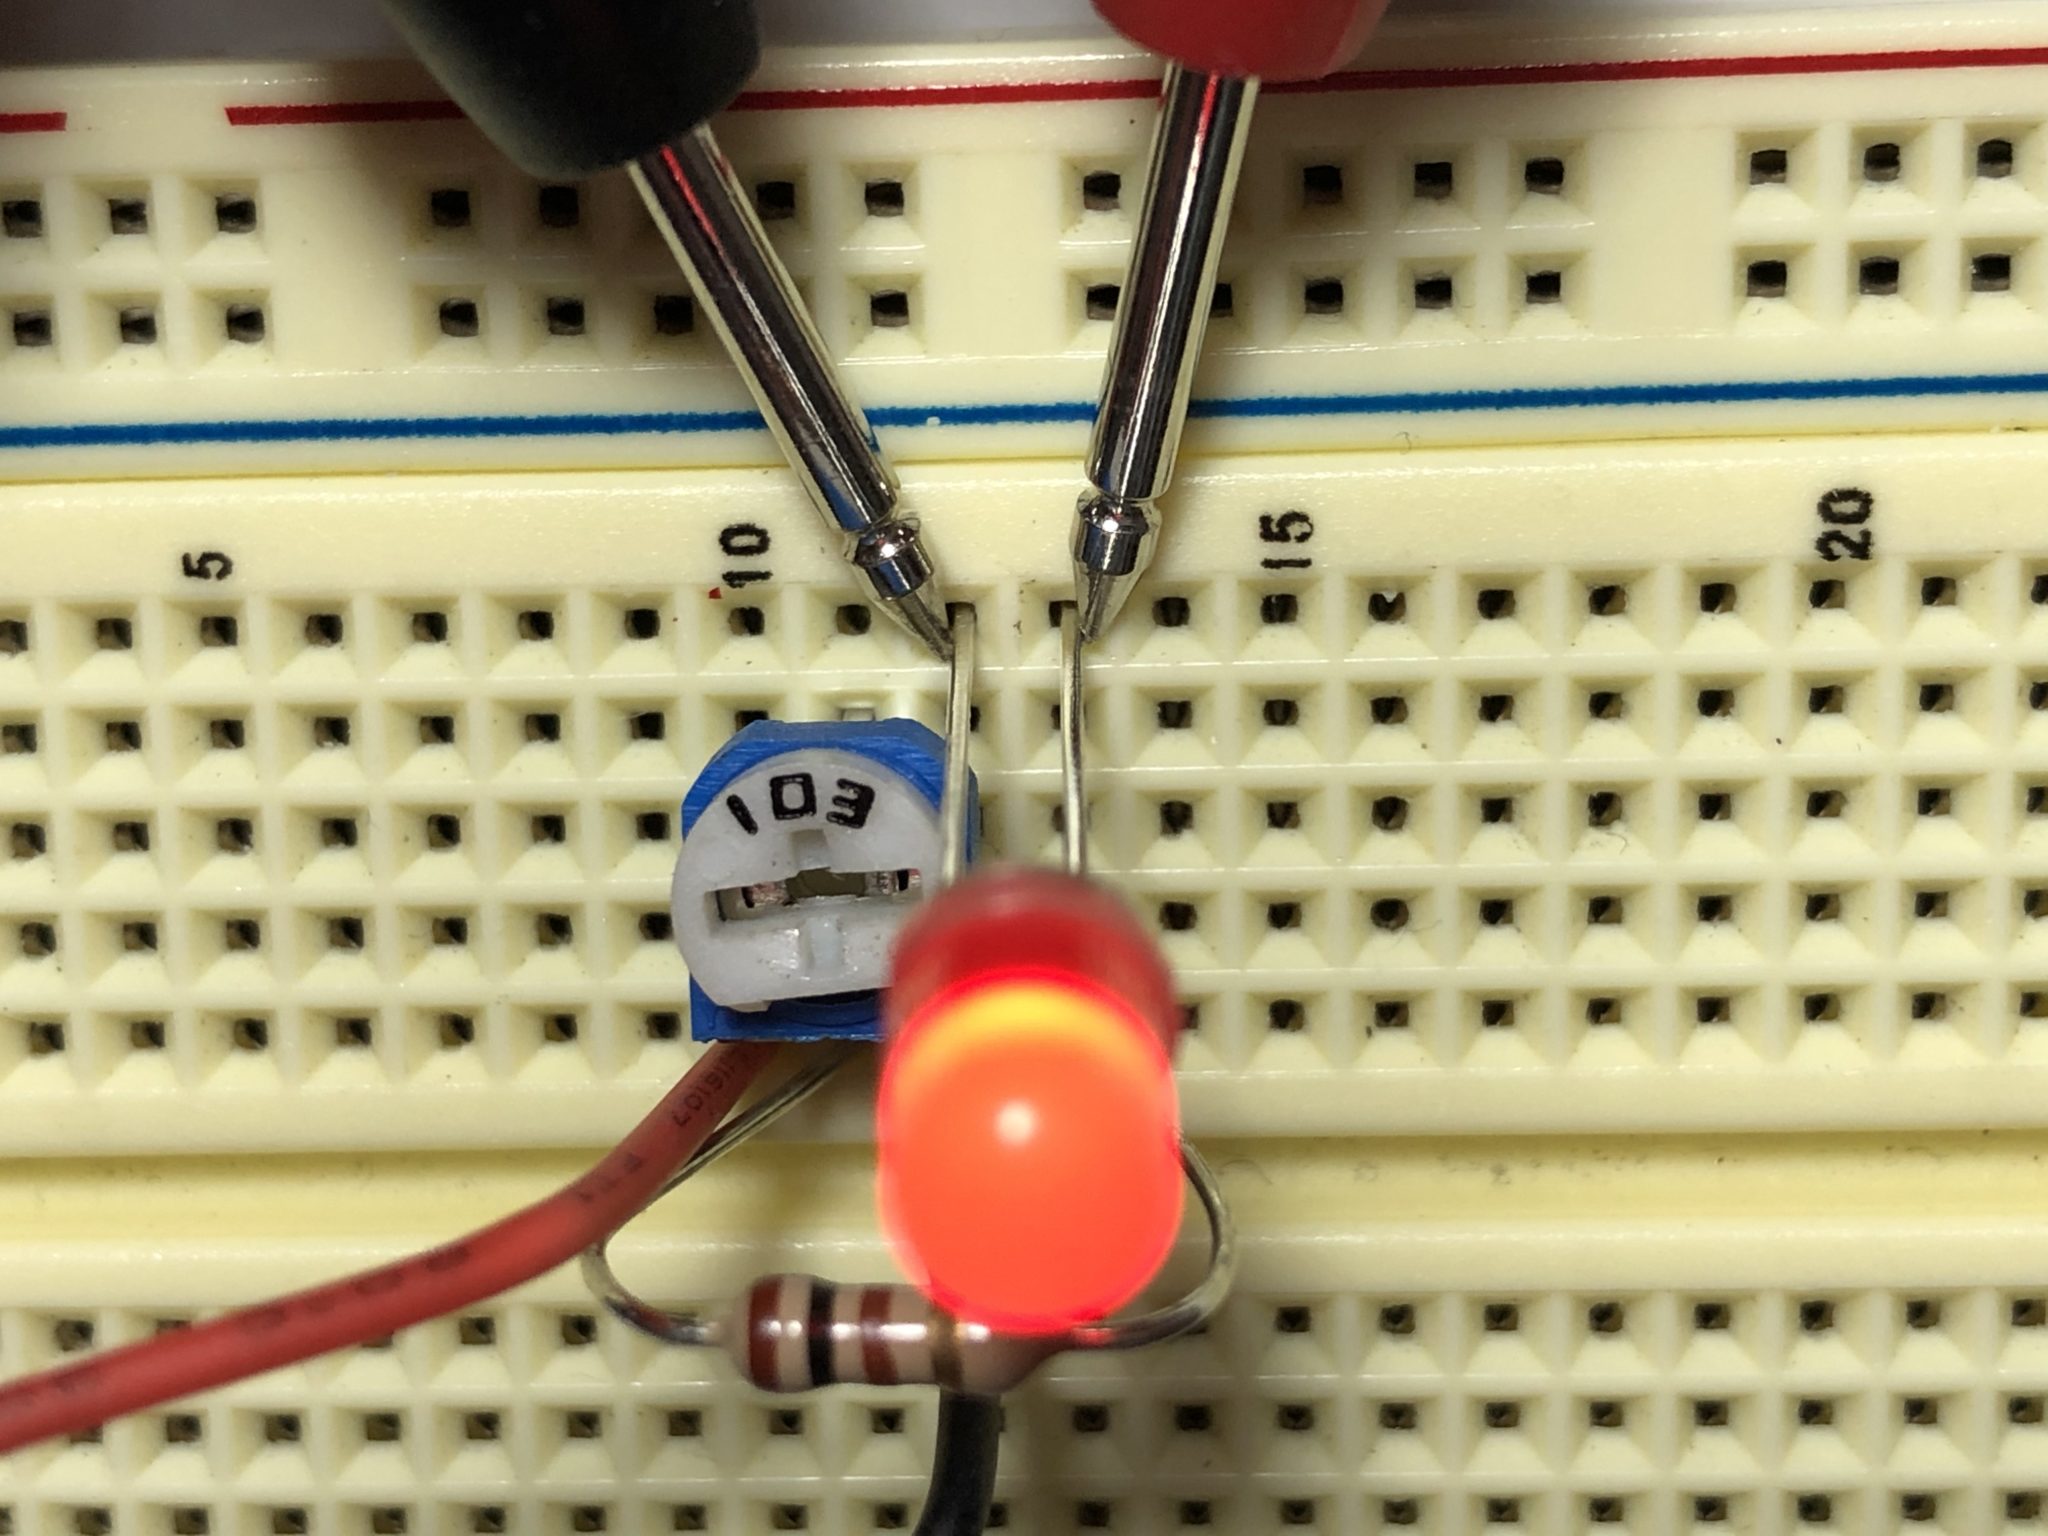
- Place a multimeter lead on each leg of the resistor and turn the potentiometer until the voltage reads 0.1V, either positive or negative. You should see the LED start to glow.

- We’re essentially making a current measurement using the resistor and an application of Ohm’s Law. We’ll explore this in a future lab, but just know that what we’re doing is supplying the LED with 10 mA.

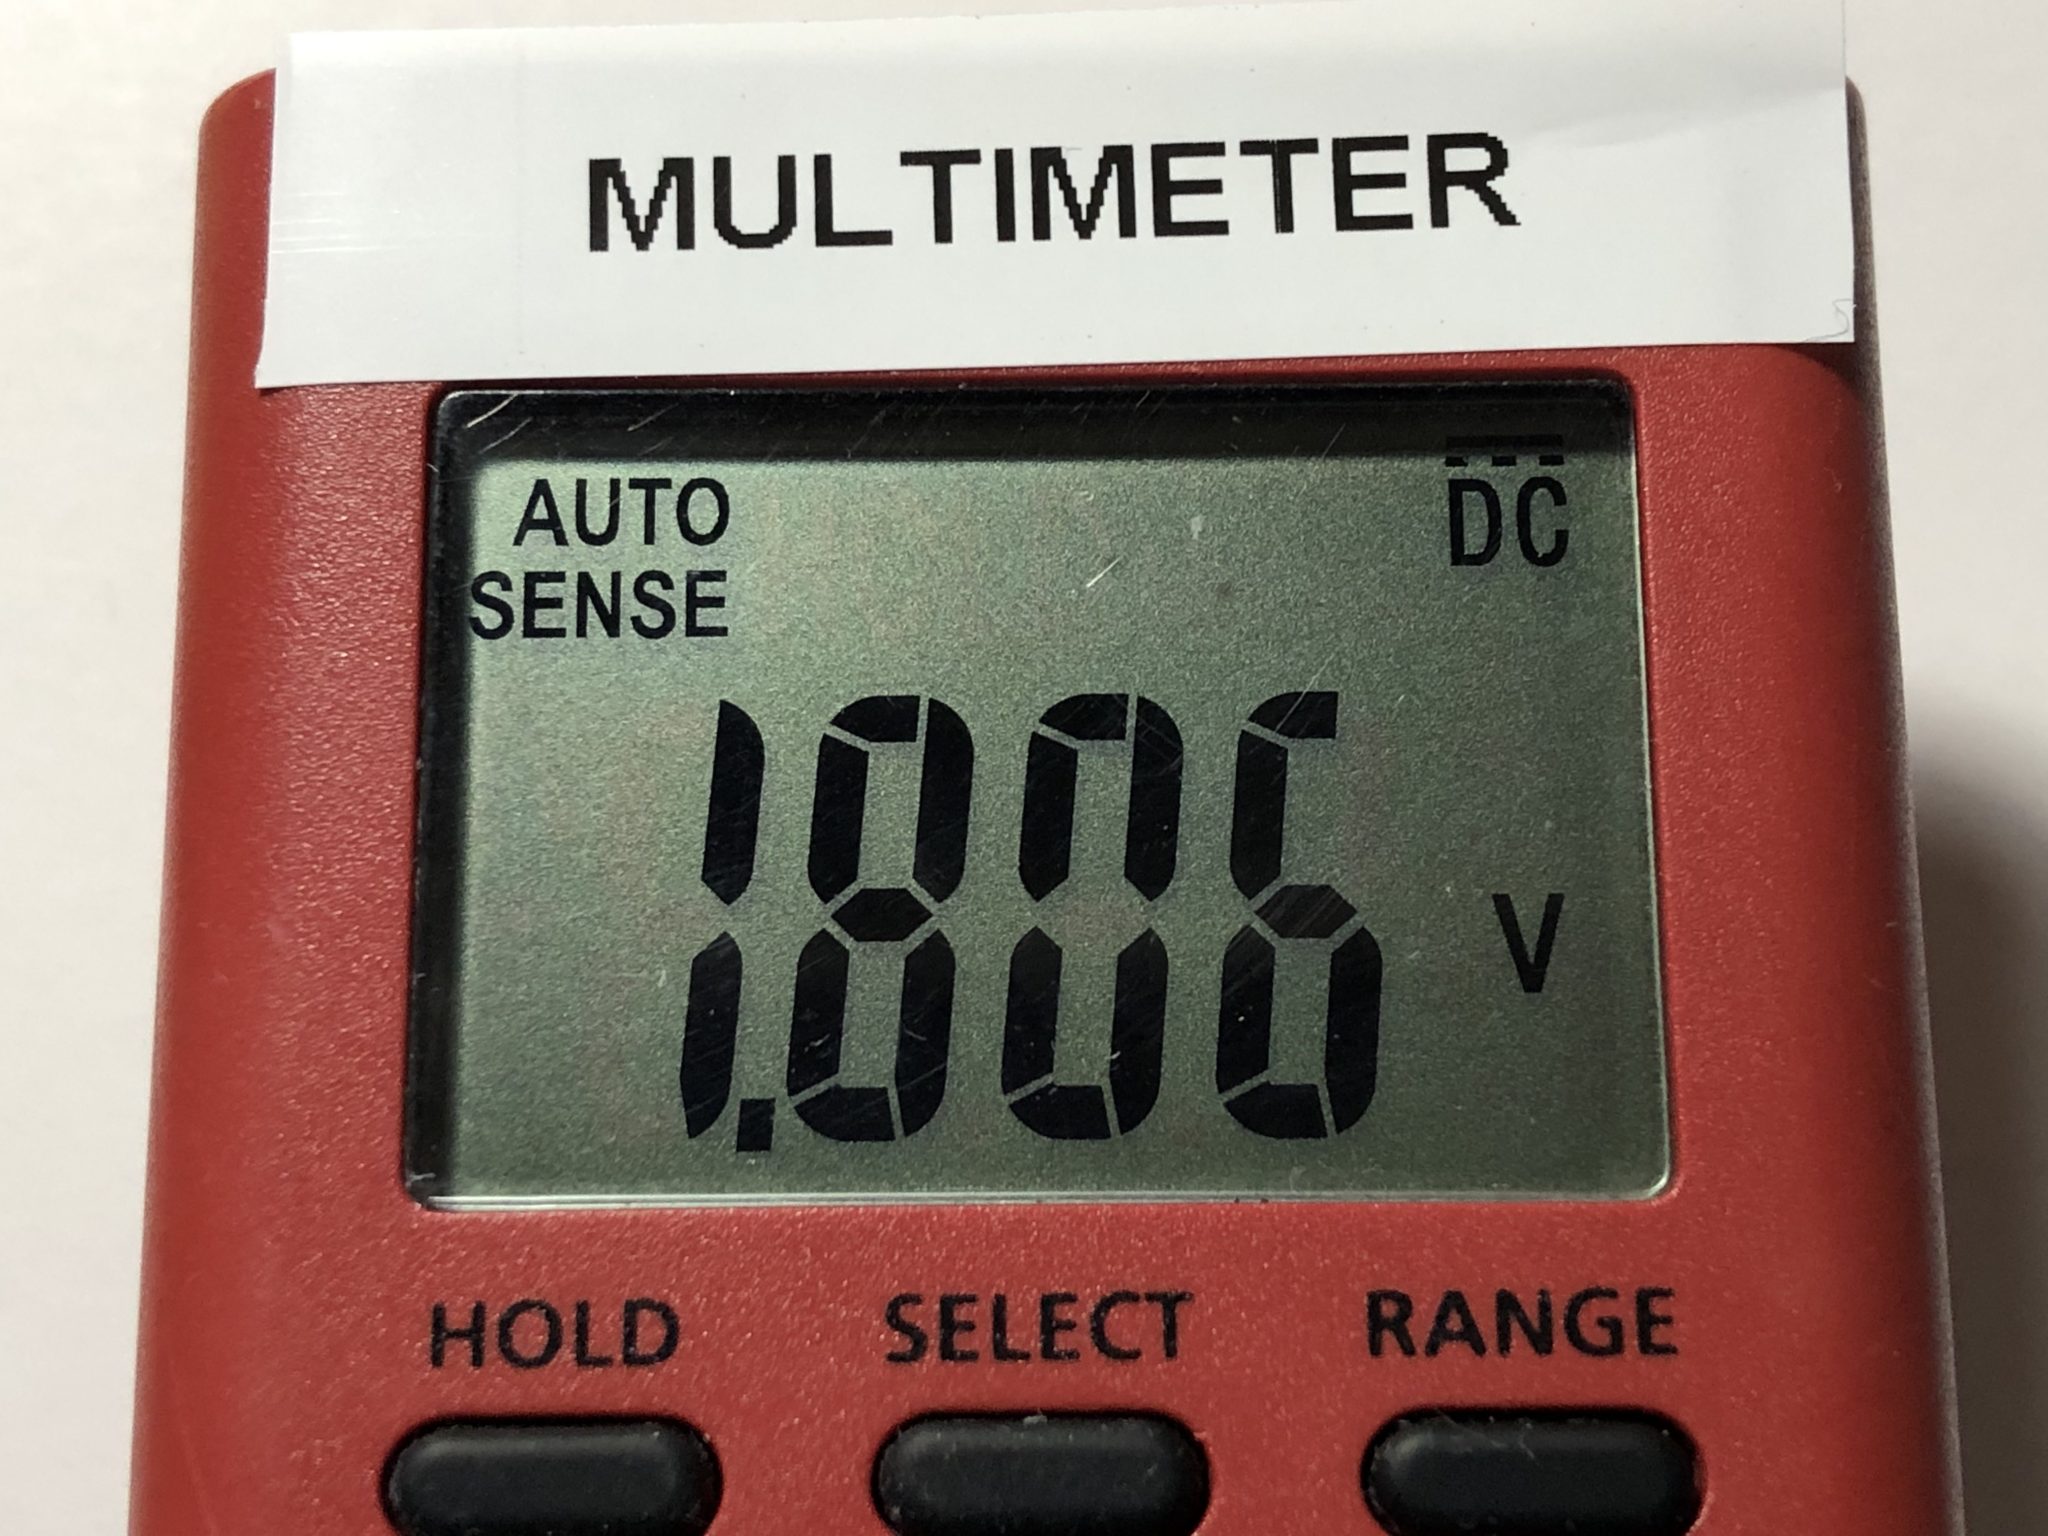
- Measure the voltage across the LED. Record this value. This is the LED’s Forward Voltage.
- Rotate the potentiometer back to its starting position.
- Change LEDs and repeat Steps 3-5.


Lab B: Materials
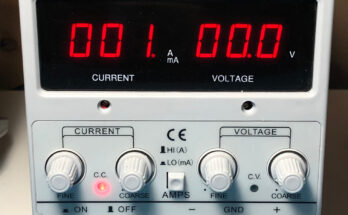
- Bench-Top Power Supply
- The power supply needs to have voltage and current regulation, as well as digital displays or dials to measure these values.
- Power Supply Leads
- Use “banana jack” style leads with alligator clips on the ends.
- Various LEDs
- Preferably, you’ll want at least a Red, Green, and Blue LED.
- (optional) Multimeter
- Multimeters are usually more accurate than the voltage/current readouts on the power supply, so you should use it to double-check your measurements if you have one.
Lab B: Procedure
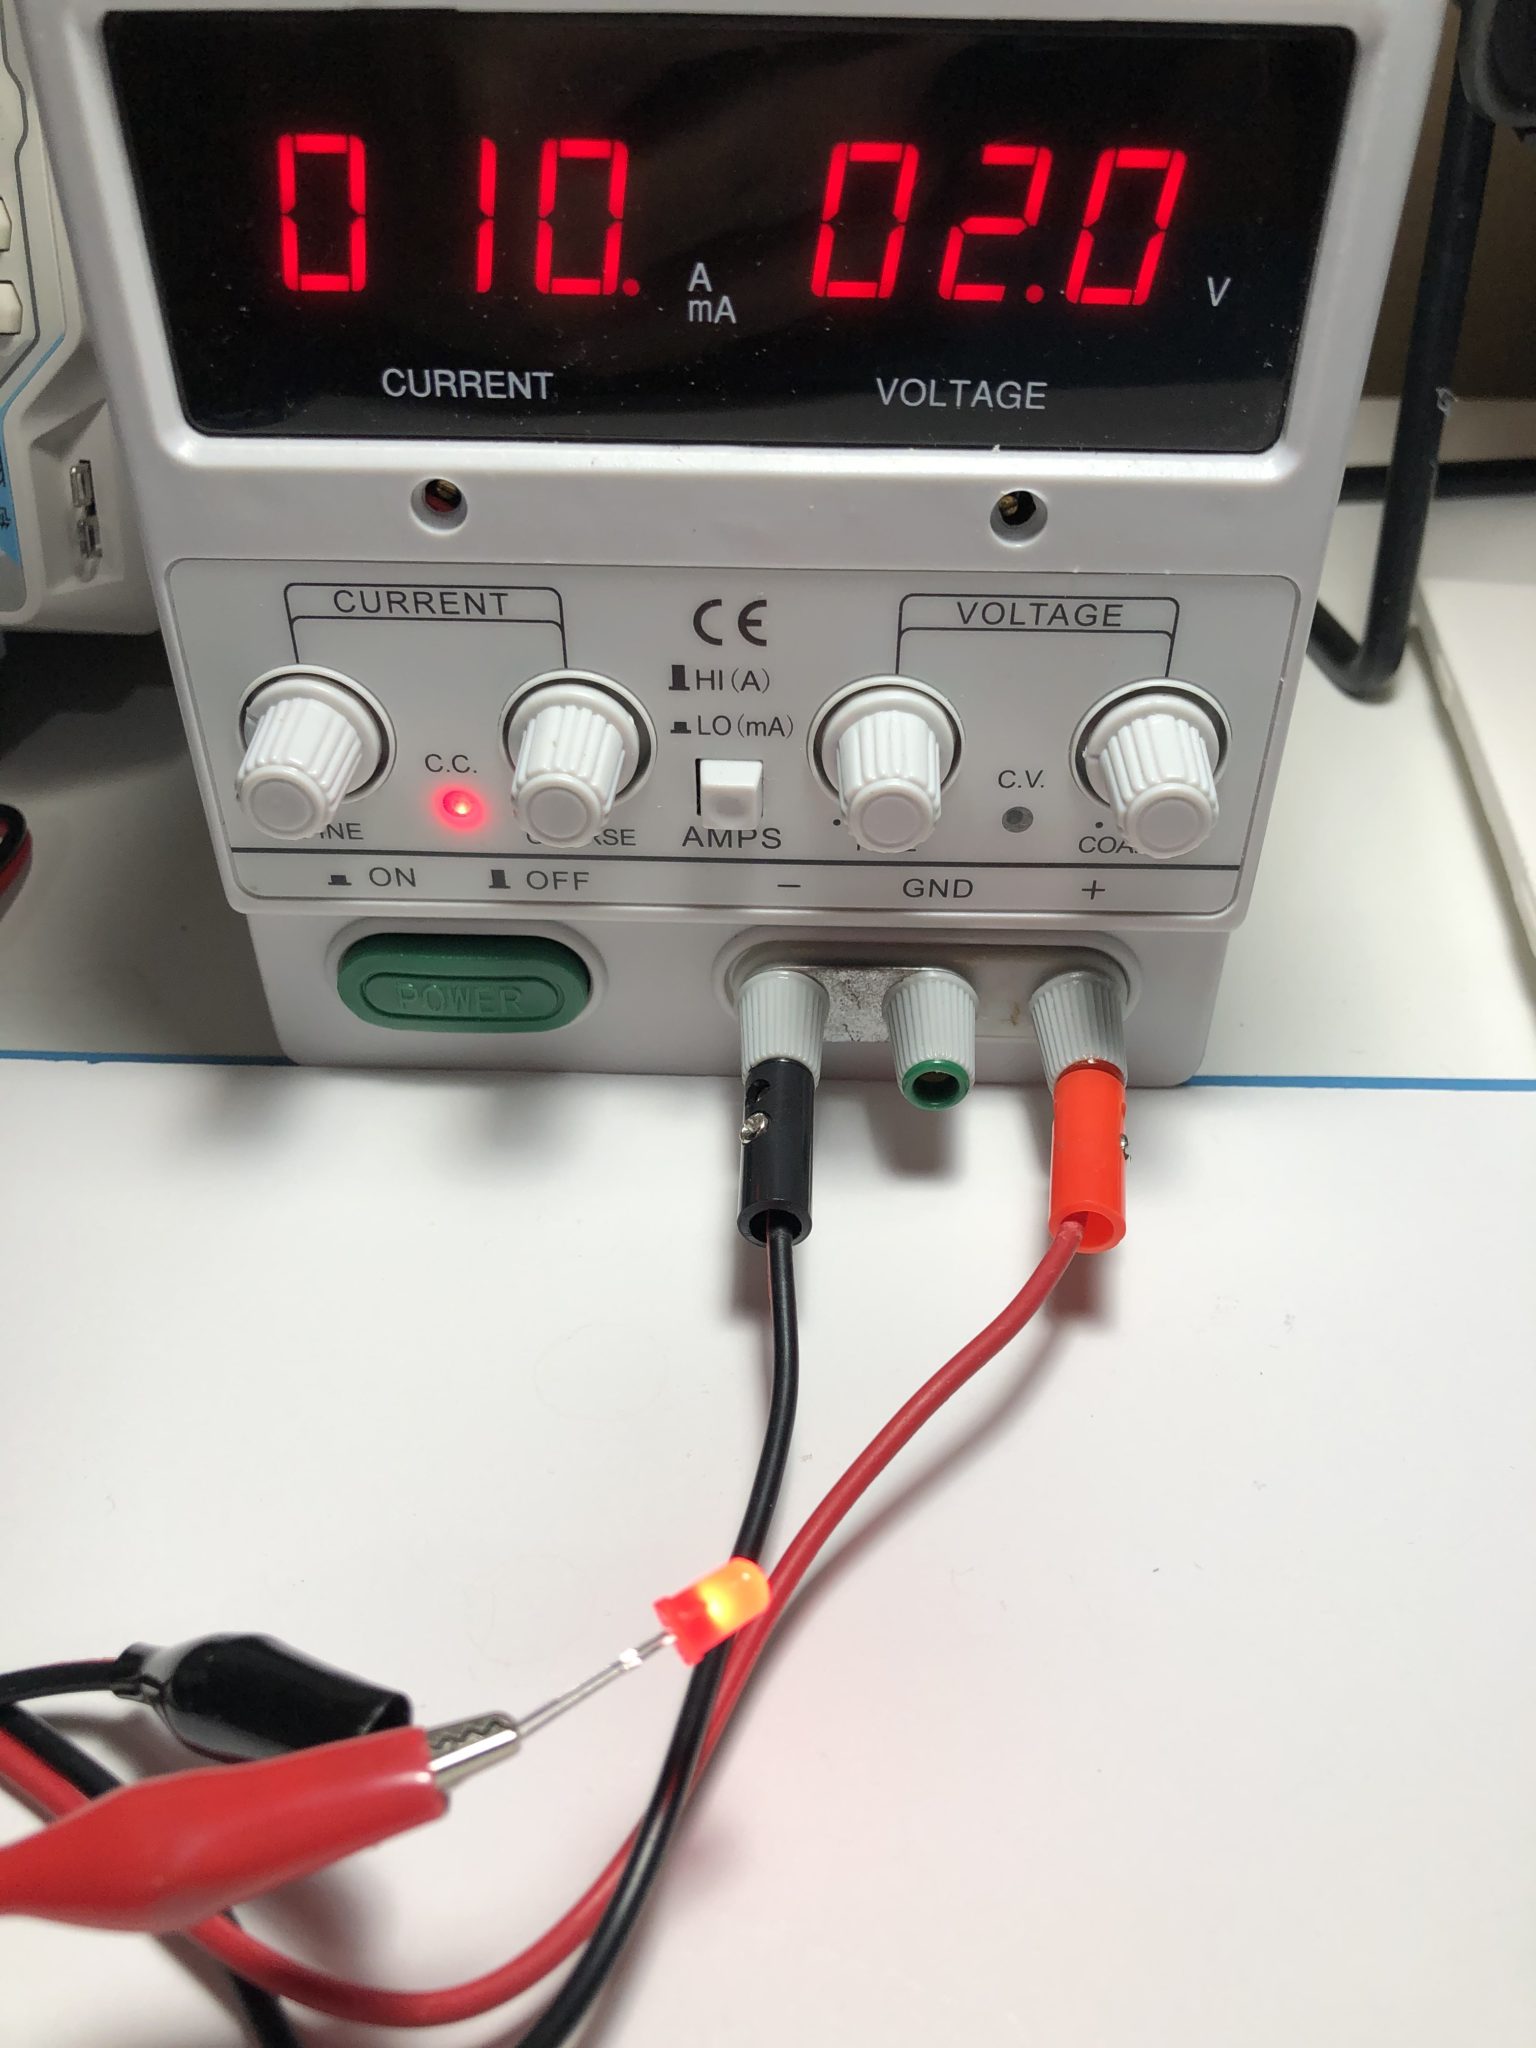
- Set your power supply’s current limit to 10 mA.
- On some power supplies, this can be accomplished by setting it to a low voltage (0.1V), shorting its output, and turning the current limit until it reads 10 mA.
- Turn the voltage setting all the way down.
- Connect an LED to the power supply leads.
- Slowly increase the voltage until it no longer rises. The LED should start lighting at around 1-2V.
- Record the voltage at which this occurs. This is the LED’s Forward Voltage.
- Turn the voltage all the way down again.
- Replace the LED with another and repeat Steps 3-6.
Troubleshooting
- LED does not light
- Check that the LED’s polarity is correct. An LED will only light up when current is flowing from its positive lead to its negative lead.
- If you’re doing Lab A, make sure your battery has enough charge. Measure the voltage with your multimeter. This lab should work with a battery as low as 5V (a very, very drained 9V battery!)
- If you’re doing Lab B, make sure the power supply’s output has been enabled. Some power supplies have a button that lets you enable or disable their output.
- If none of the above steps work, your LED might be bad. Set it aside and notify your lab instructor.
- Check that the LED’s polarity is correct. An LED will only light up when current is flowing from its positive lead to its negative lead.
- LED gets very bright, then suddenly goes out
- Your potentiometer may have been rotated the wrong way when you started. This would cause a very high current to flow through the LED, which has damaged it. Don’t worry, LEDs aren’t too expensive! Set it aside, notify your lab instructor, and consider it a learning experience. Make sure the voltage across the LED reads zero volts when the potentiometer is at its starting position.
My Results (Spoiler!)
| LED Color | Forward Voltage (V) |
| Infrared | 1.09 |
| Red | 1.80 |
| Orange | 1.84 |
| Yellow | 1.87 |
| Yellow-Green | 1.88 |
| Green | 2.36 |
| Blue | 2.65 |
| White | 2.66 |
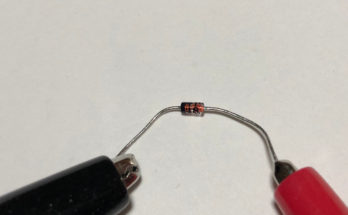
| 1N914 | 0.62 |
Along with the usual colors of LEDs, I also tested infrared and white LEDs, and a regular 1N914 small-signal diode. Notice how the forward voltage for a normal diode is much, much less than for an LED.

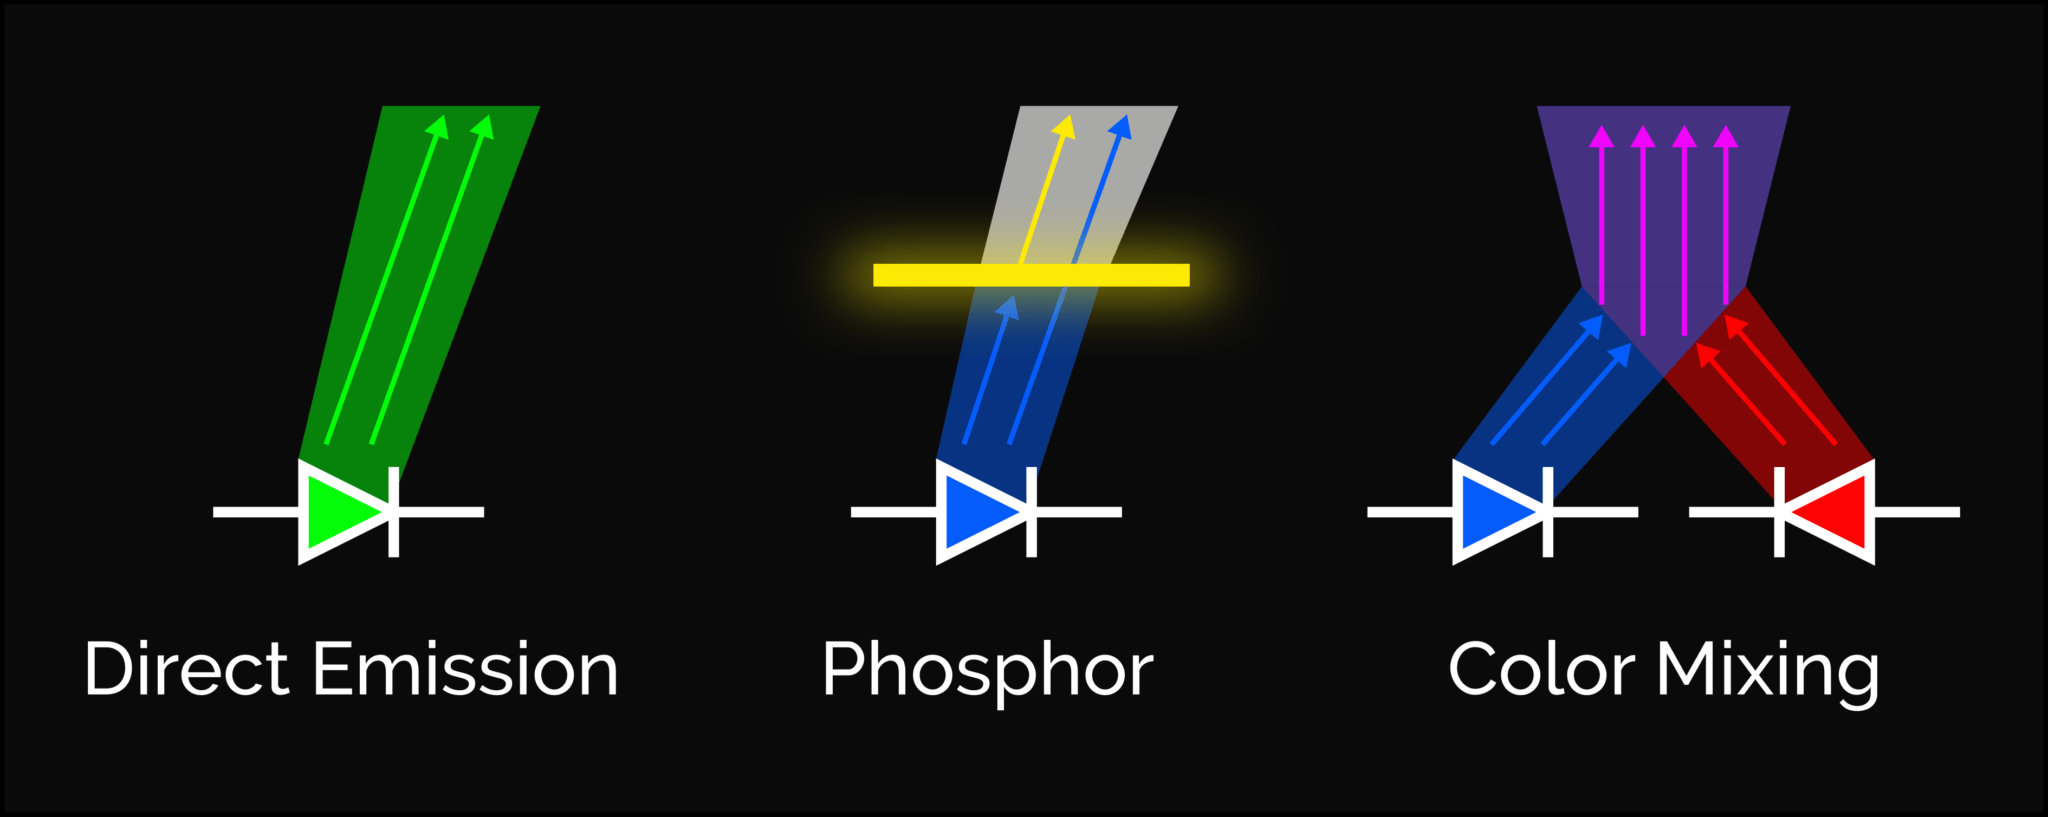
As we explored in a previous lab, white LEDs are actually blue LEDs with a yellow phosphor. The fact that its forward voltage is very similar to that of the blue LED tells us that this particular white LED was made this way.
Discussion
Here’s a table of common LED colors and their (approximate) wavelengths [2]:
| Color | Wavelength (nm) |
| Red | ~670 |
| Orange | ~610 |
| Yellow | ~580 |
| Yellow-Green | ~560 |
| Green | ~540 |
| Blue | ~470 |
Did you notice how LEDs with bigger wavelengths have a lower forward voltage?
Here’s a handy formula for determining the energy of a photon of a particular wavelength [3]:
In other words:
Note how the energy increases as the wavelength decreases.
Putting this into the above table, we have:
| Color | Wavelength (nm) | Photon Energy (eV) |
| Red | ~670 | ~1.9 |
| Orange | ~610 | ~2.0 |
| Yellow | ~580 | ~2.1 |
| Yellow-Green | ~560 | ~2.2 |
| Green | ~540 | ~2.3 |
| Blue | ~470 | ~2.6 |
This tells us how much energy an electron must lose in order to produce a photon of a given wavelength. Notice how the units are electron-Volts (eV), which is the charge of an electron times 1 Volt. You may be tempted to compare these values to the forward voltages you measured, but they’re not exactly comparable. Because of some other effects, the forward voltage of an LED multiplied by the charge of an electron is actually less than the photon energy! However, they should be at least proportional to the values you measured [4].
Bonus: Actually Measuring LED Wavelength
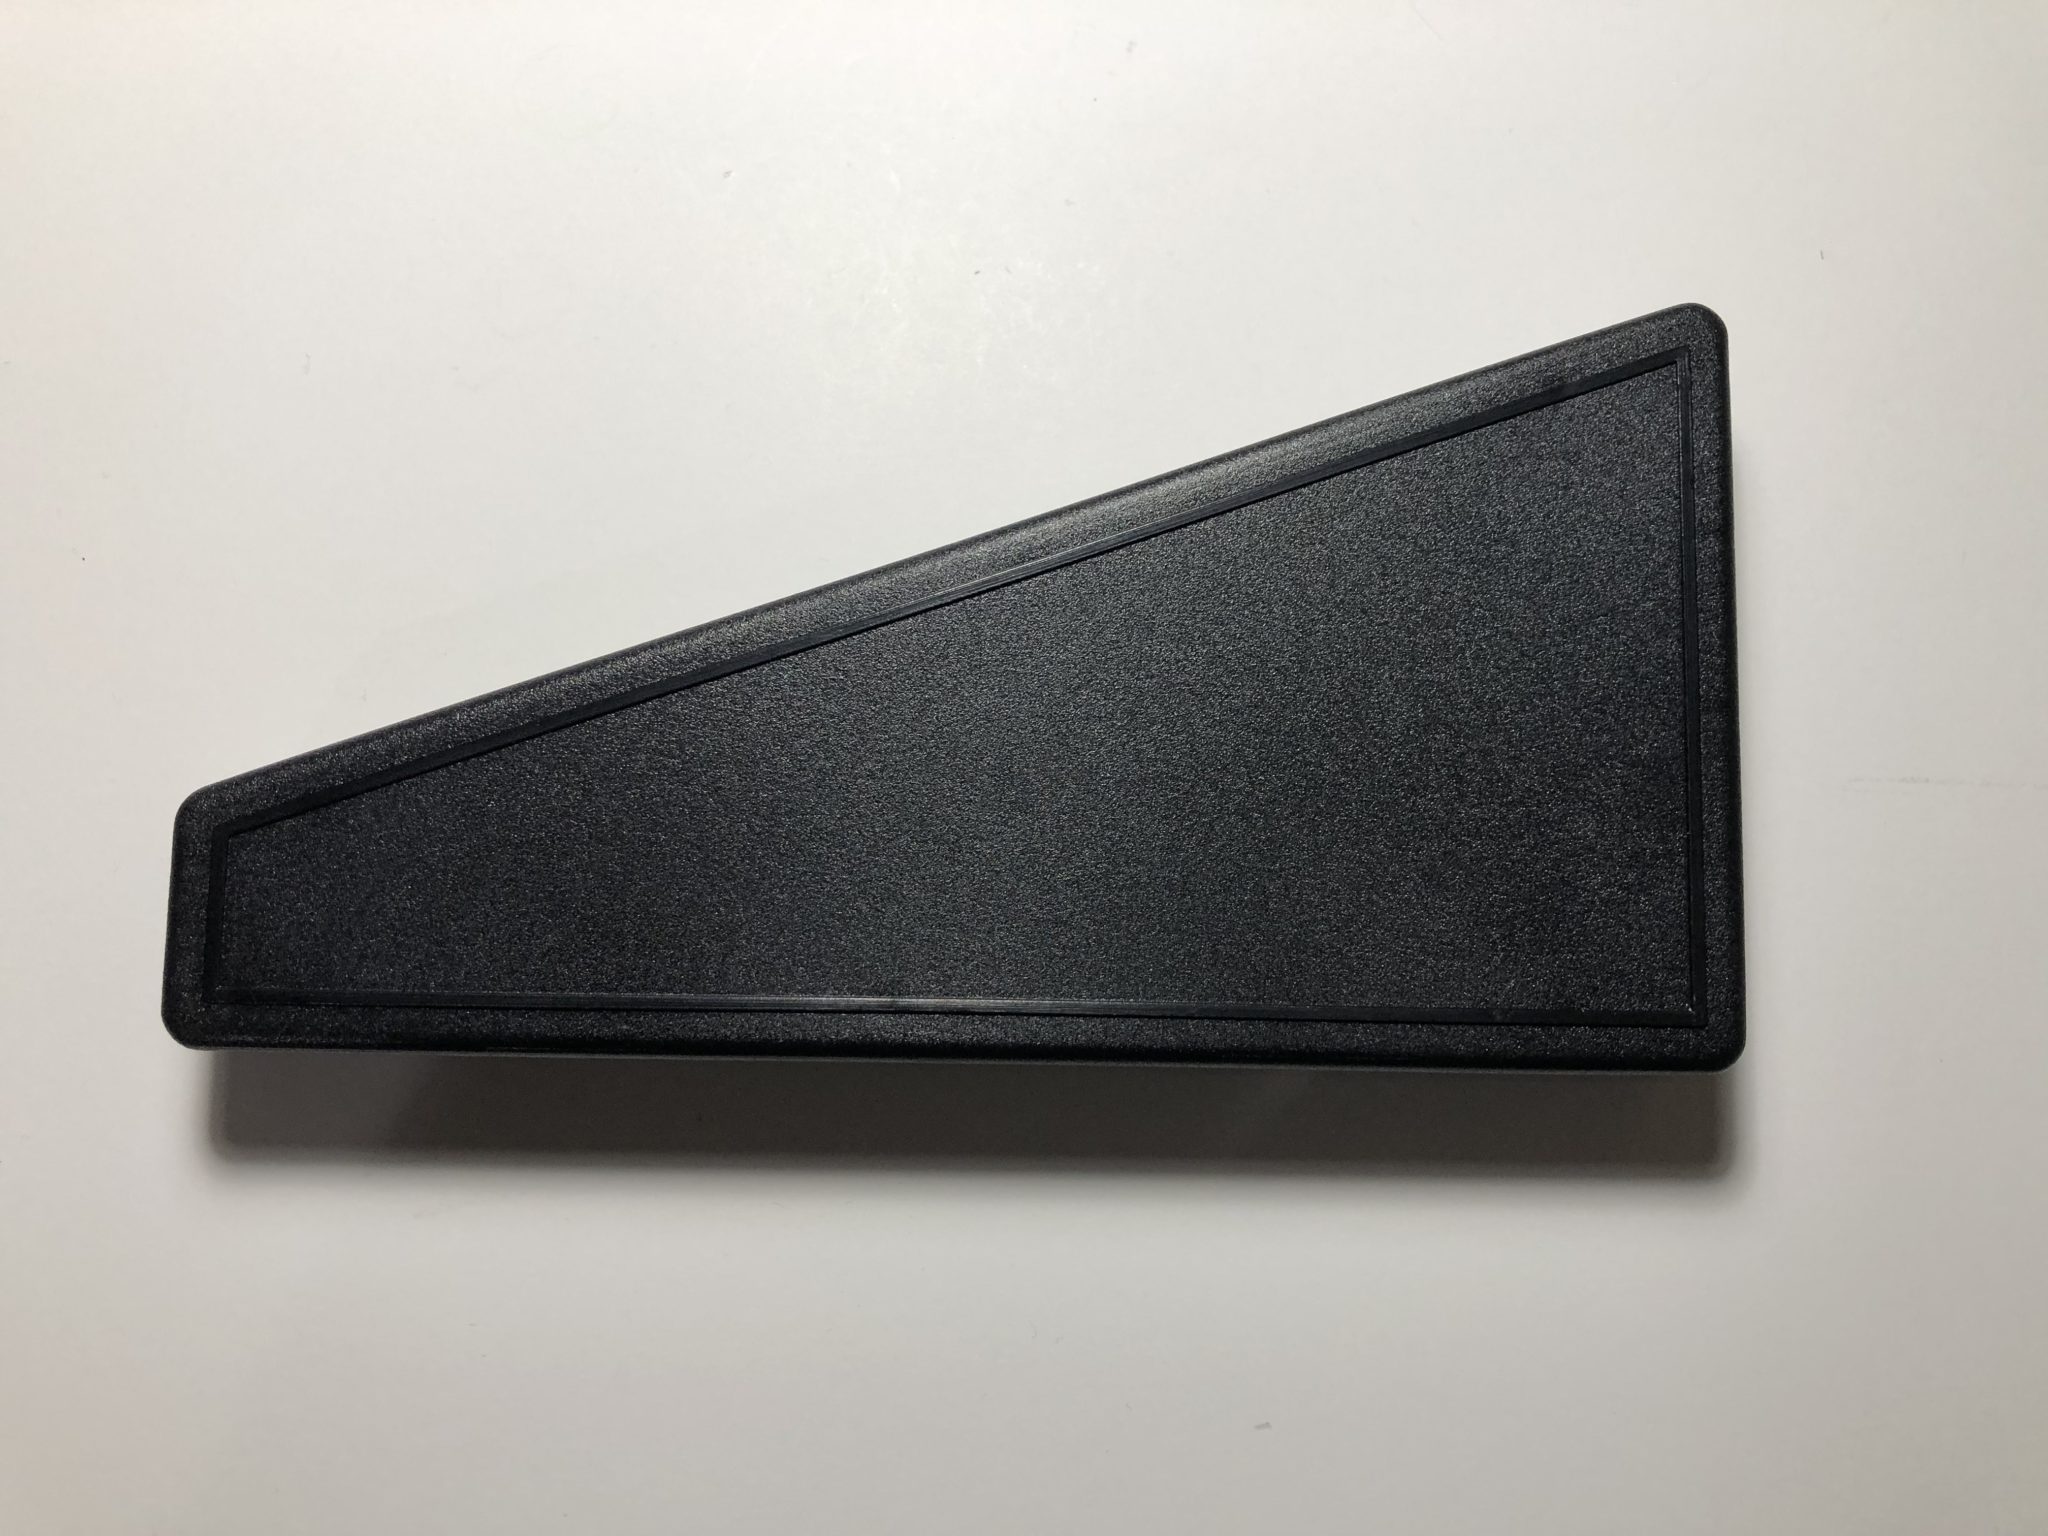
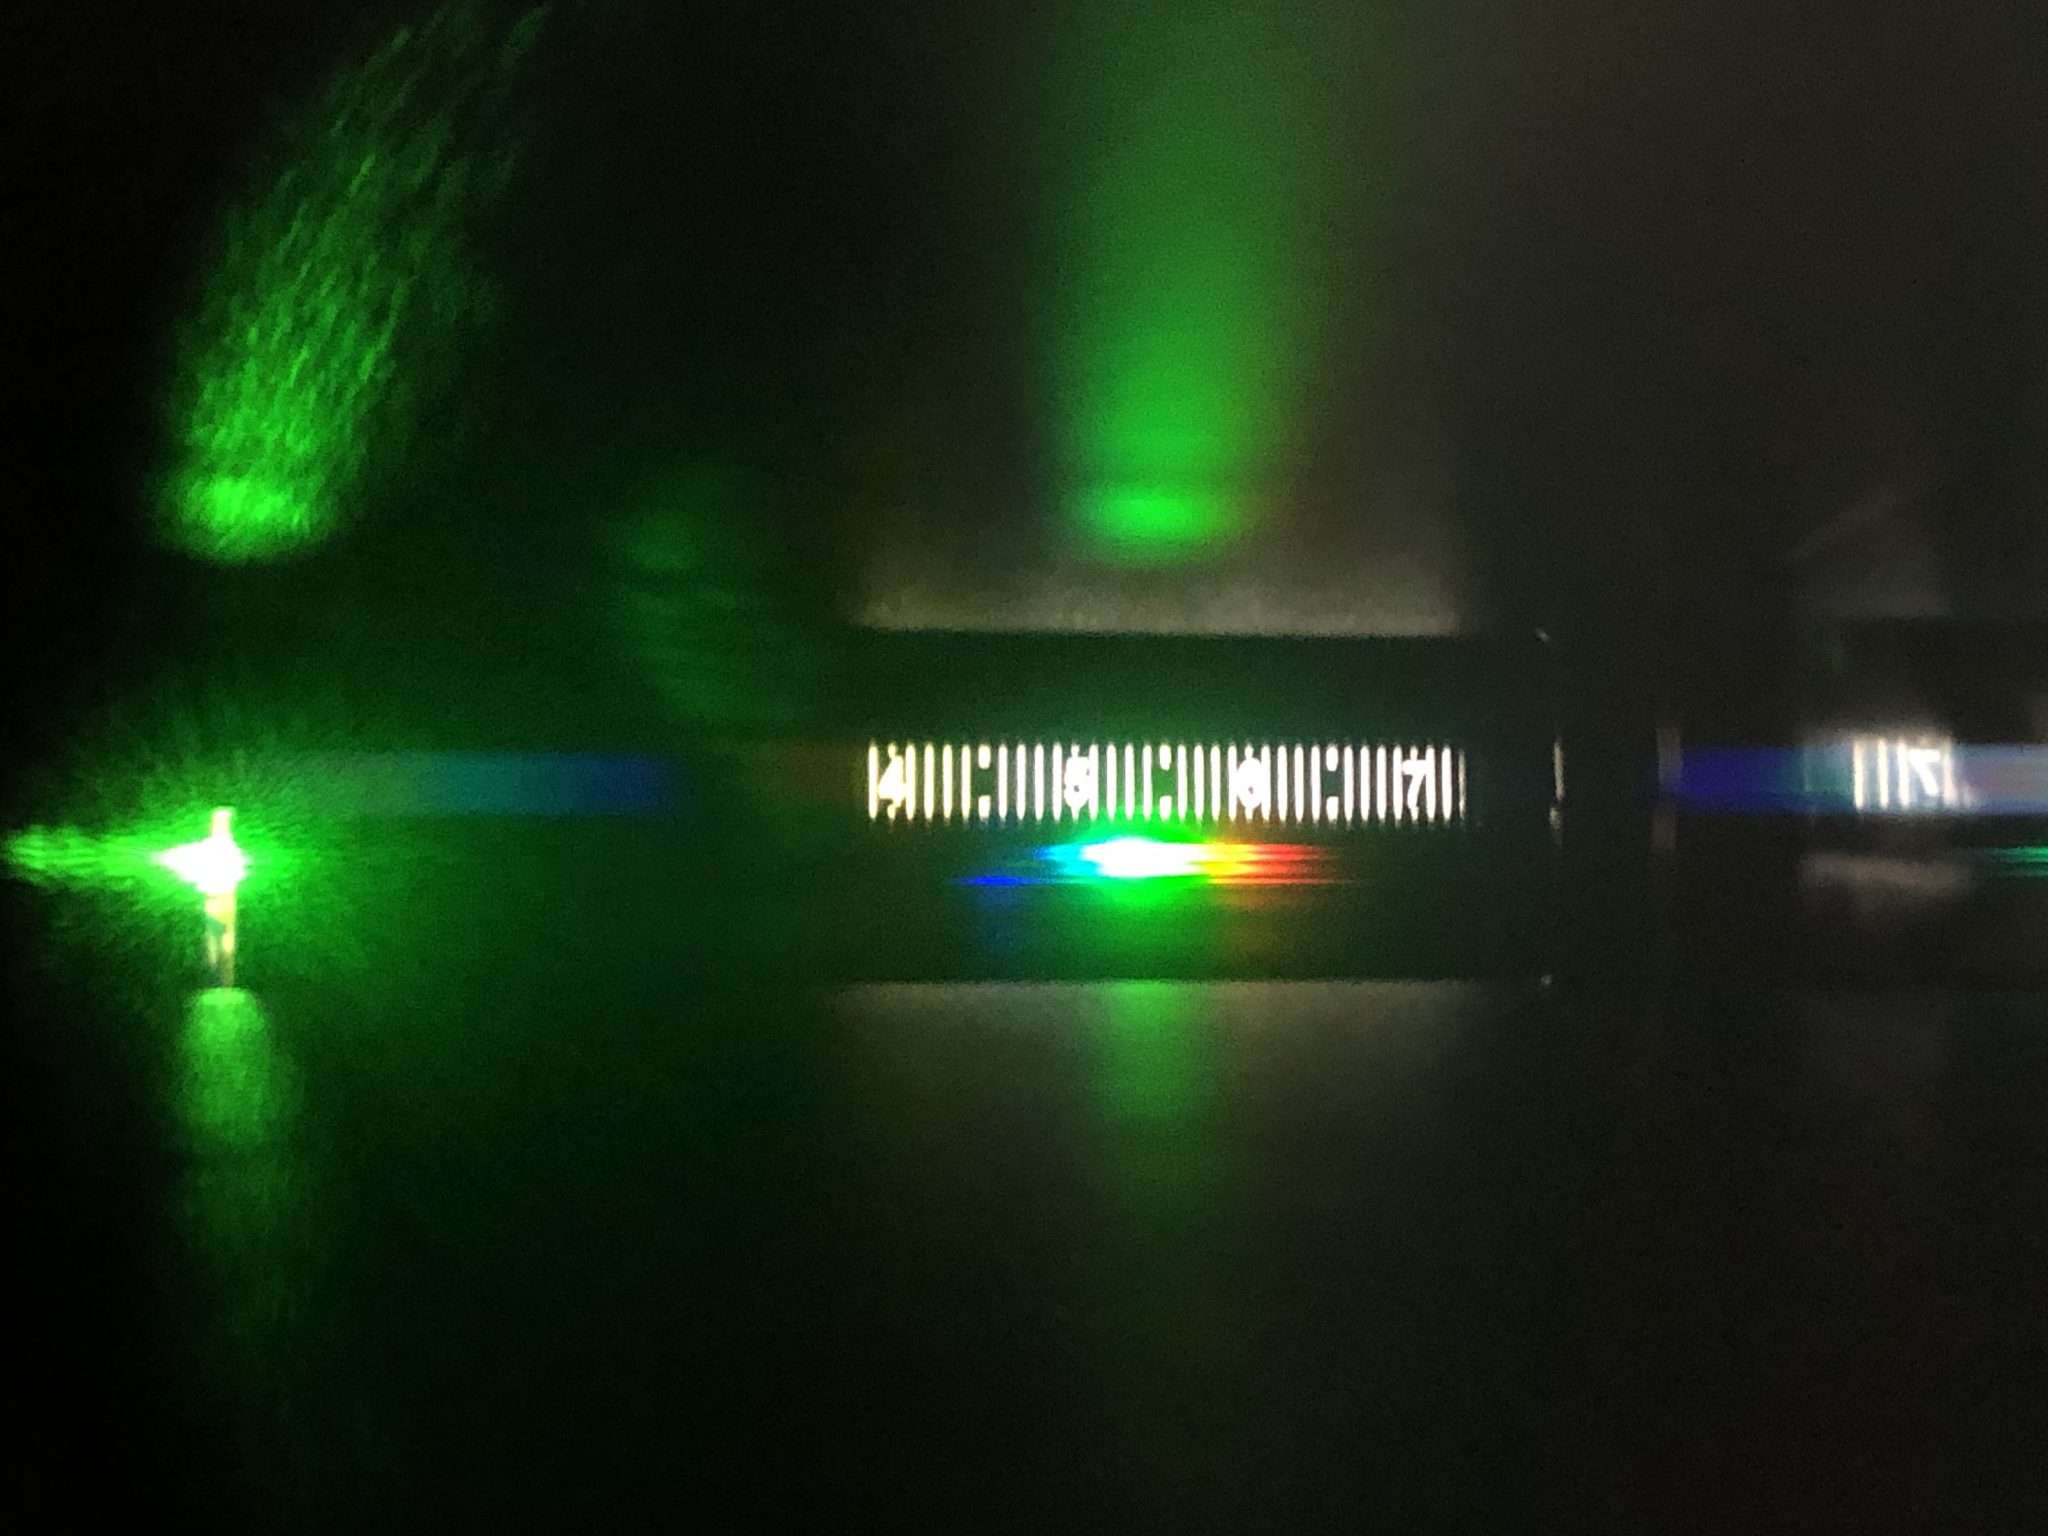
If you have a spectroscope or spectrometer, you can actually measure the wavelength of your LEDs! The spectroscope I used is an Eisco PH 0100QA (not affiliated with them), which are inexpensive and relatively accurate. You can usually find these for a few dollars on many physics or chemistry supply websites.
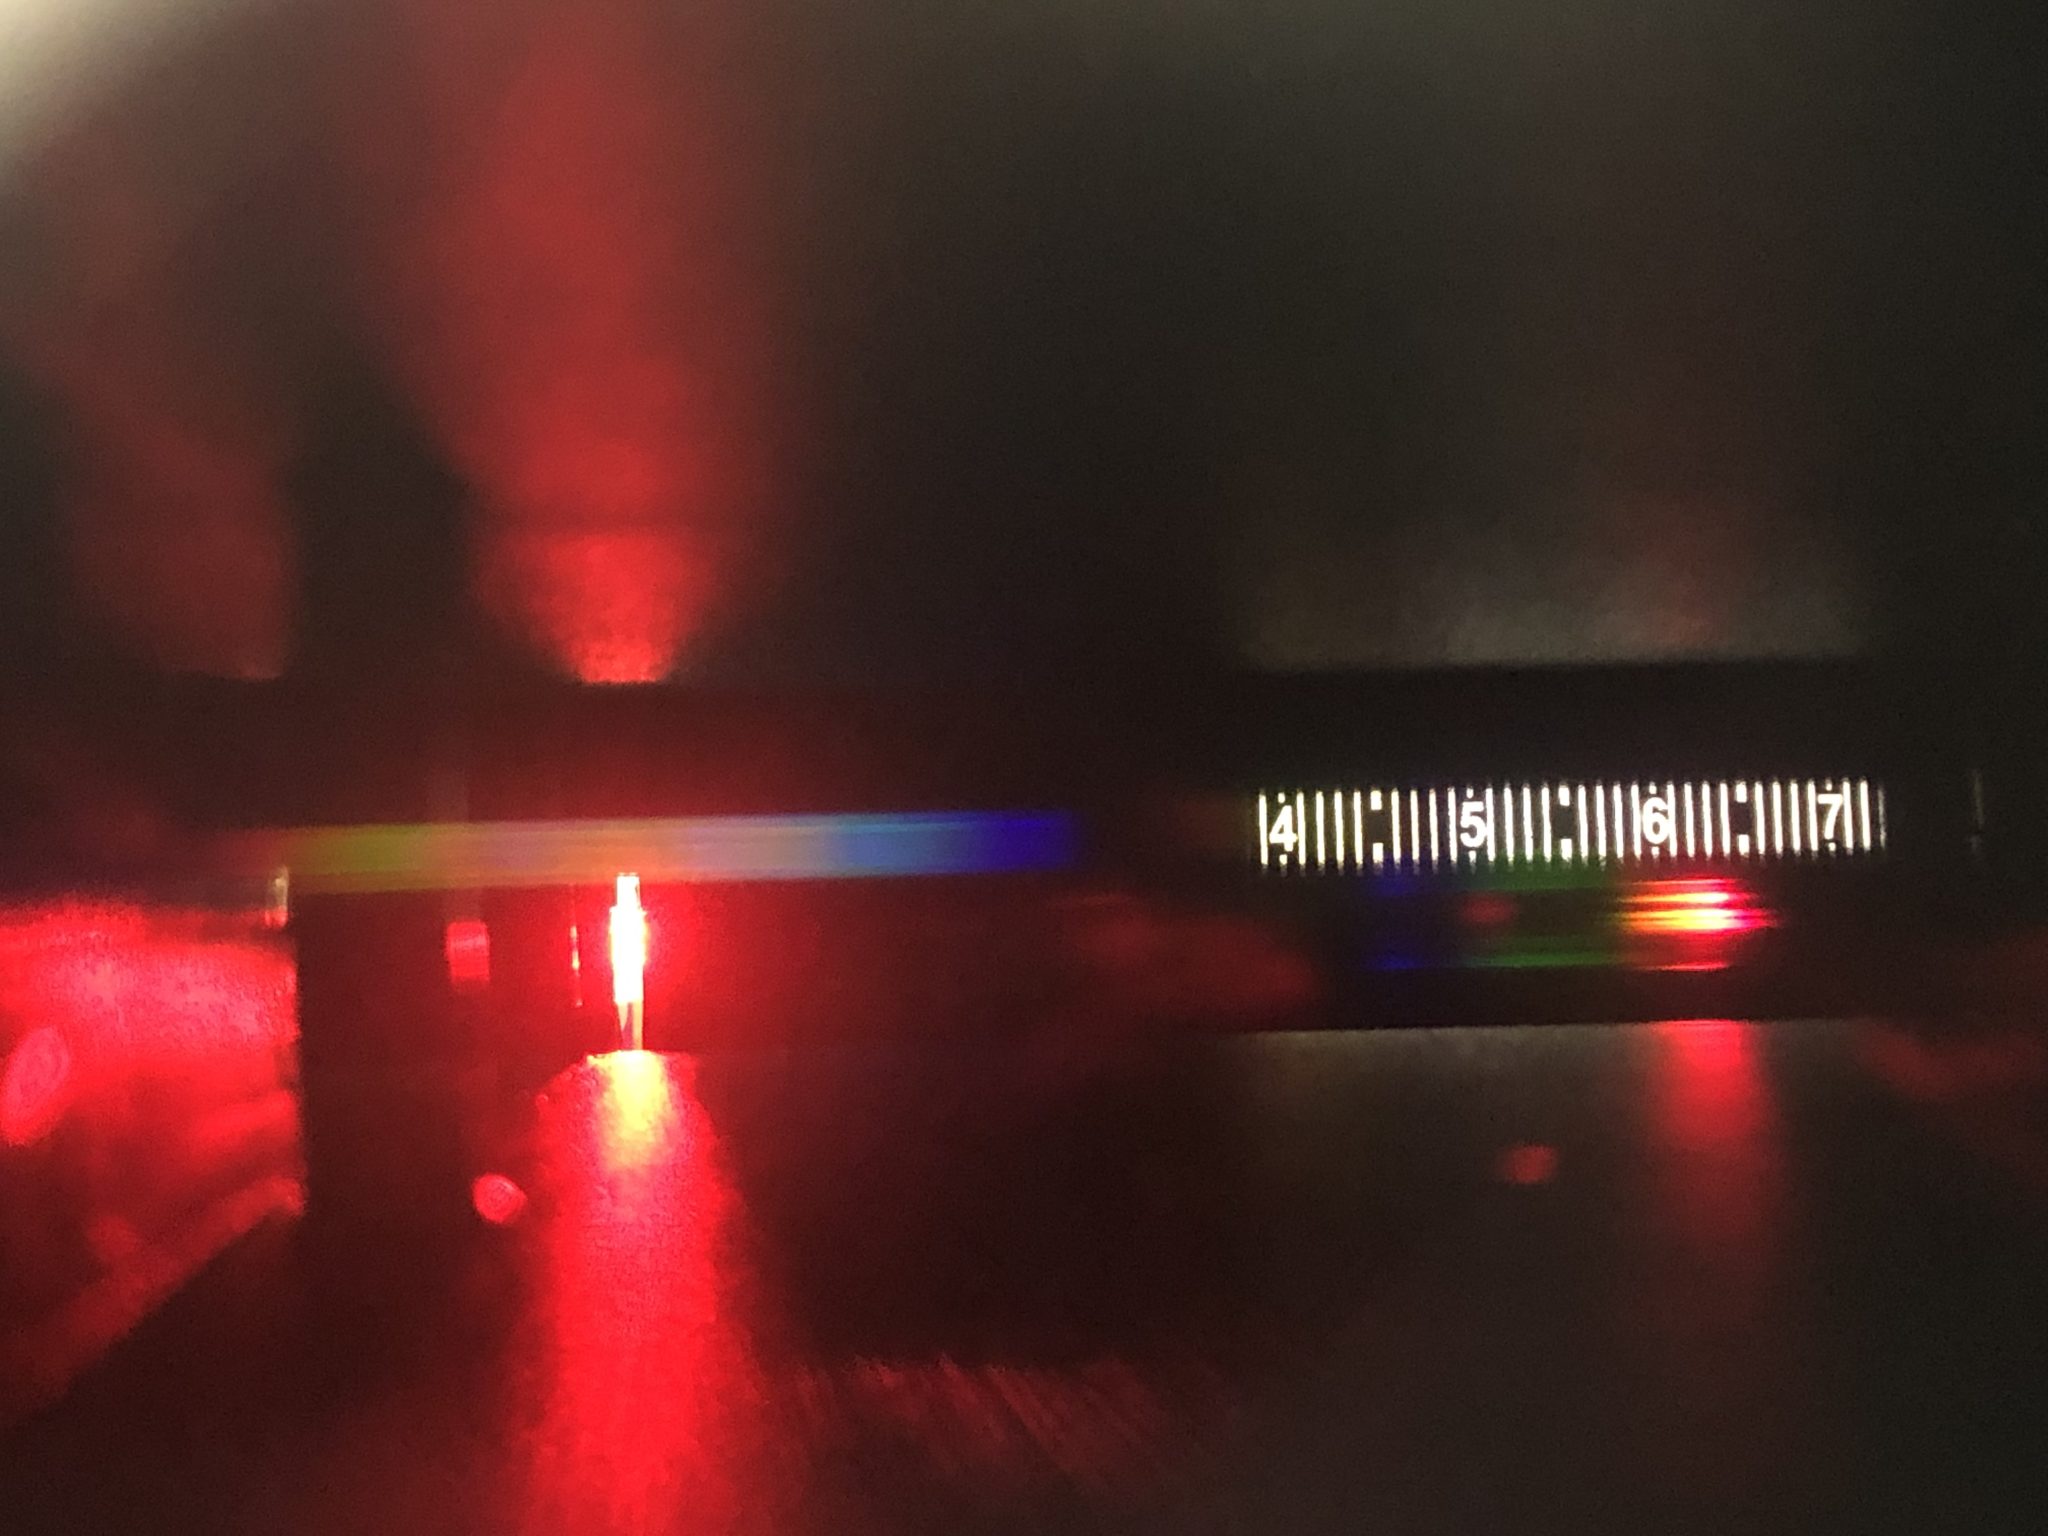
For the Eisco spectroscope, you look through the eyepiece and aim the tube so that the light you want to measure shines through the slit on the other end. You should see a bright spot on the right side of your field of view, where there’s a number scale. The peak wavelength is where the spot is the brightest. These spectroscopes usually work best in a slightly darkened (not totally dark) room, where you have just enough light to see the numbers.

Using my spectroscope, I measured the following wavelengths for my LEDs:
| Color | Wavelength (nm) |
| Infrared* | 940 |
| Red | 630 |
| Orange | 600 |
| Yellow | 585 |
| Yellow-Green | 560 |
| Green | 530 |
| Blue | 465 |
*I got this one off the datasheet so we have a basis for comparison, as Infrared is invisible to the naked eye, and the spectroscope doesn’t go that high anyways.
When you relate wavelength to LED forward voltage, you get this nice-looking graph:
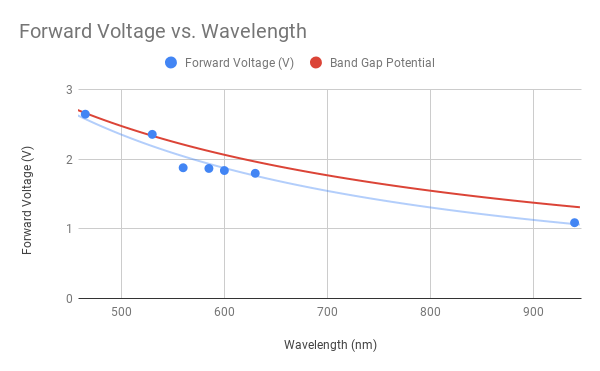
| Wavelength (nm) | Forward Voltage (V) |
| 940 | 1.09 |
| 630 | 1.80 |
| 600 | 1.84 |
| 585 | 1.87 |
| 560 | 1.88 |
| 530 | 2.36 |
| 465 | 2.65 |
Remarks
Unlike lasers, LEDs aren’t terribly precise. Their wavelengths can move around quite a bit depending on temperature and current (which is probably just heating up the LED). This is because higher temperatures cause the LED’s band gap to grow narrower, decreasing the energy of emitted photons [5].
Tried this experiment? Comment below with your observations!
References
- https://en.wikipedia.org/wiki/Light-emitting_diode_physics; http://hyperphysics.phy-astr.gsu.edu/hbase/Electronic/led.html
- https://en.wikipedia.org/wiki/Color
- http://faculty.sites.uci.edu/chem1l/files/2013/11/RDGLED.pdf; https://en.wikipedia.org/wiki/Photon_energy
- https://www.spiedigitallibrary.org/conference-proceedings-of-spie/11143/111432S/Is-a-glowing-LED-meaningful-to-determine-the-Planks-constant/10.1117/12.2508193.full?webSyncID=9a0ce46e-9e6e-c7a4-9dab-6a0cbad05932&sessionGUID=9ad883c9-d902-bc99-93ce-d268bead49a2; http://electron6.phys.utk.edu/phys250/Laboratories/Light%20emitting%20diodes.htm
- https://en.wikipedia.org/wiki/Band_gap